
This is a practice solution for StrataScratch question ID 10130.
Understanding how inspections are distributed across risk categories and inspection types helps city regulators and public health officials see where their efforts are actually landing.
SELECT inspection_type,
    COUNT(*) FILTER (WHERE risk_category IS NULL) AS no_risk,
    COUNT(*) FILTER (WHERE risk_category = 'Low Risk') AS low_risk,
    COUNT(*) FILTER (WHERE risk_category = 'Moderate Risk') AS moderate_risk,
    COUNT(*) FILTER (WHERE risk_category = 'High Risk') AS high_risk,
    COUNT(*) AS total_number
FROM sf_restaurant_health_violations
GROUP BY inspection_type
ORDER BY total_number DESC;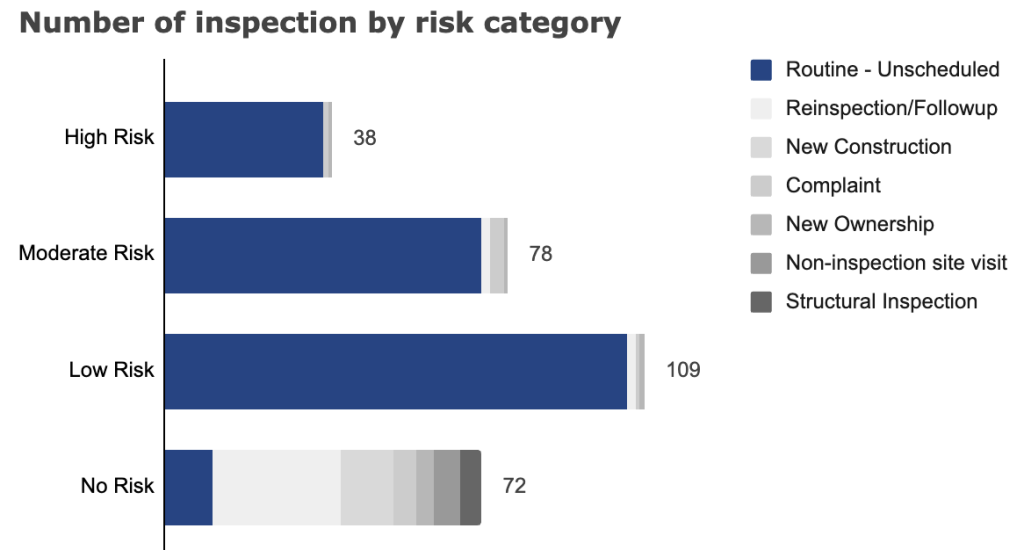
This chart shows how inspections are distributed across risk categories, with each bar broken down by inspection type. The most notable patterns are:
- Routine – Unscheduled inspections dominate every risk level, which is expected given they make up the vast majority of all inspections conducted.
- No Risk bar is the only one in which other inspection types are meaningfully represented, with Reinspection/Followup and New Construction contributing noticeably. This suggests that Reinspection/Followup inspections are largely resolving issues (landing in No Risk rather than flagging new ones), and New Constructions tend to pass cleanly.