🚀 Uncovering Insights,
Crafting Stories, Driving Clarity
Engineer turned data enthusiast. Passionate about exploring datasets and uncovering hidden insights.
——
Technical Skills: SQL | Python | Tableau | Excel | R | Data Visualization
[Project Highlights]
Data Analysis Projects

A Snapshot Analysis of Fleet Size vs. Grounded Ratio by Country

Understanding Process and Final Product Quality in a Flotation Plant
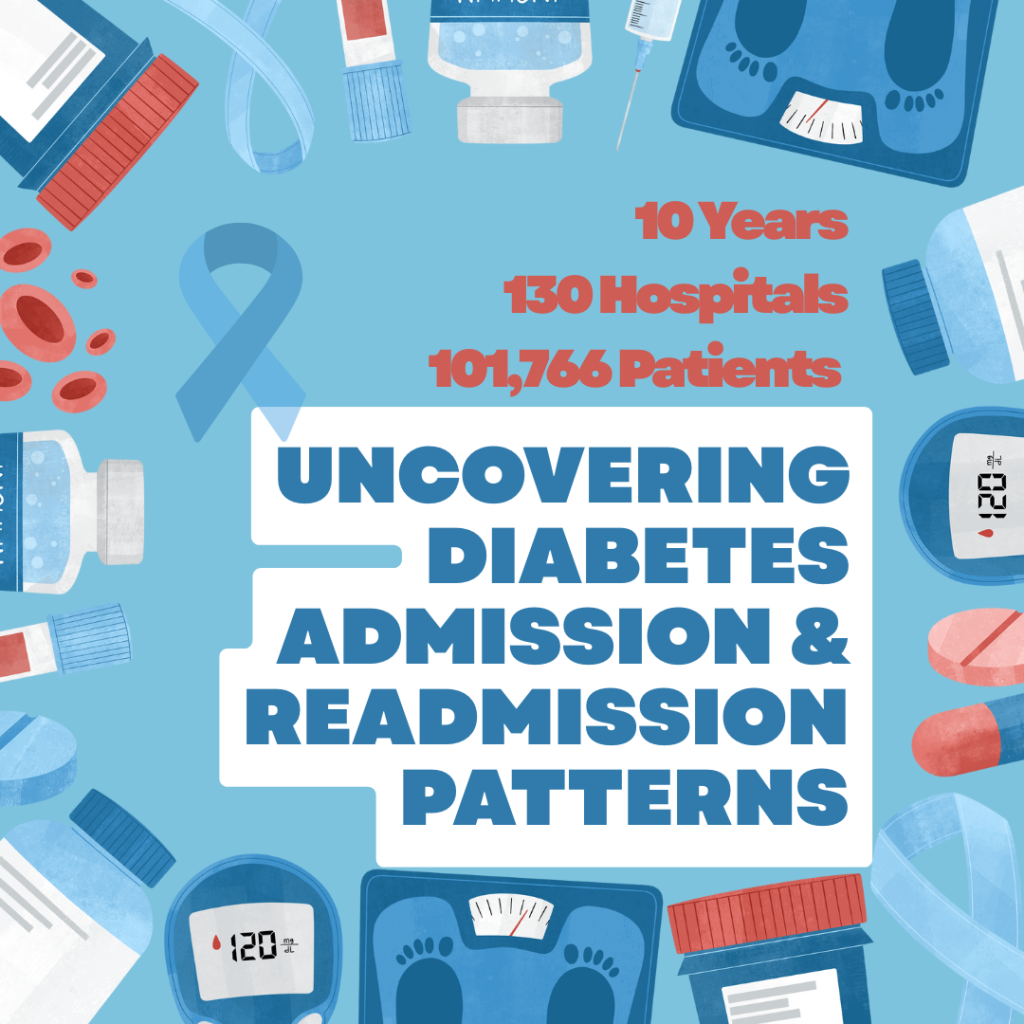
Diabetes Admission and Readmission Patterns in US Hospitals Over 10 Years
Indonesia’s IDA Journey: An SQL Analysis

Craving Success: Understanding Customer Behavior to Optimize Campaign Strategy
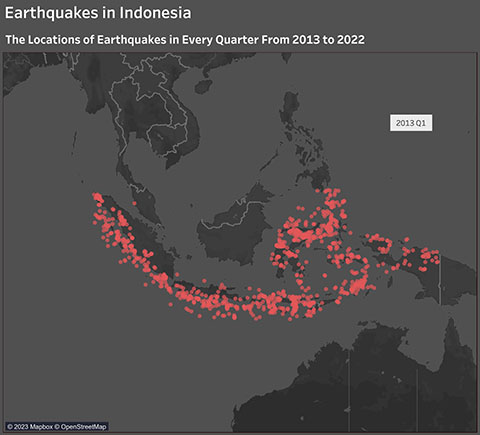
Ten Years of Quakes in Indonesia
See all Data Analysis Projects
Visualizations & Reports
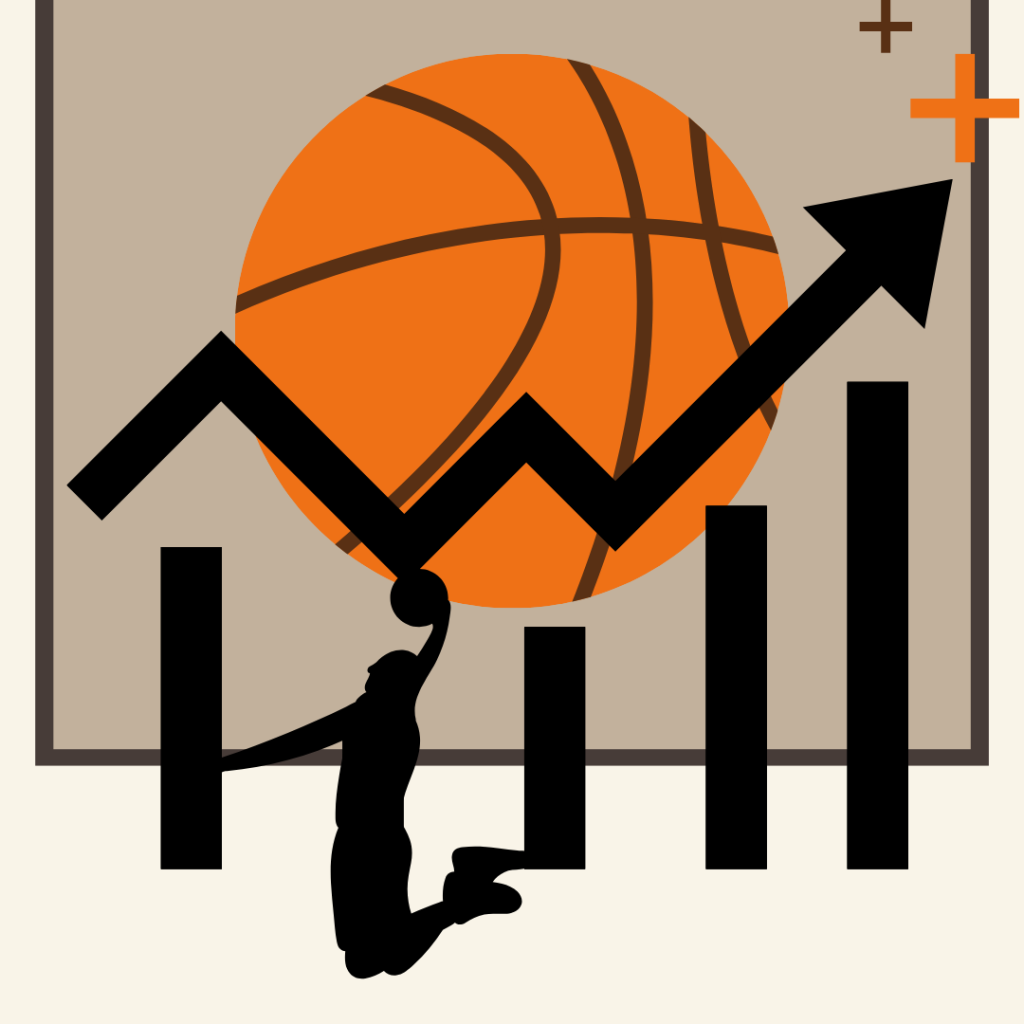
Learning Basketball Through Numbers
When Yoga Searches Broke the Pattern
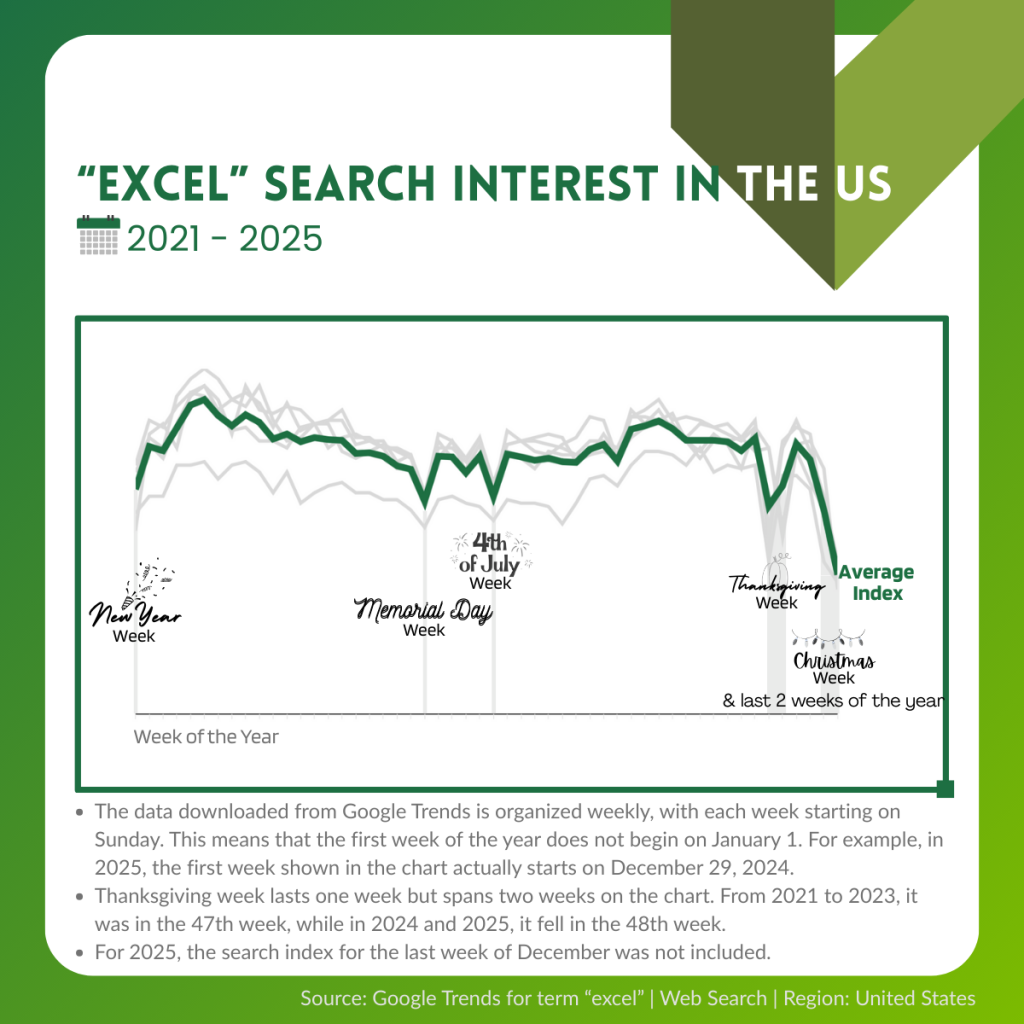
When Work Pauses, Excel Searches Pause
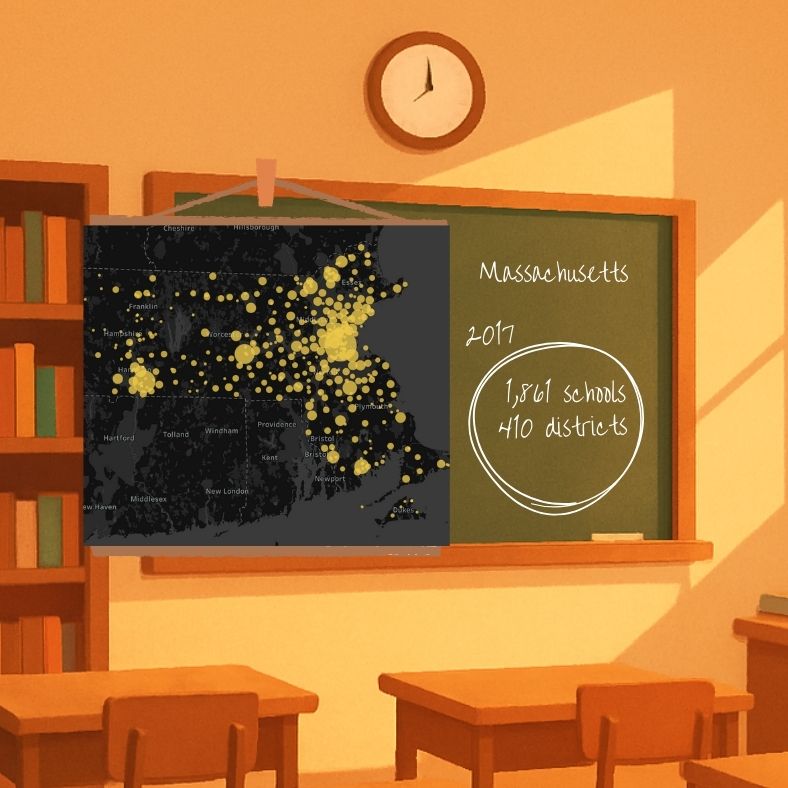
Massachusetts Education Landscape in 2017
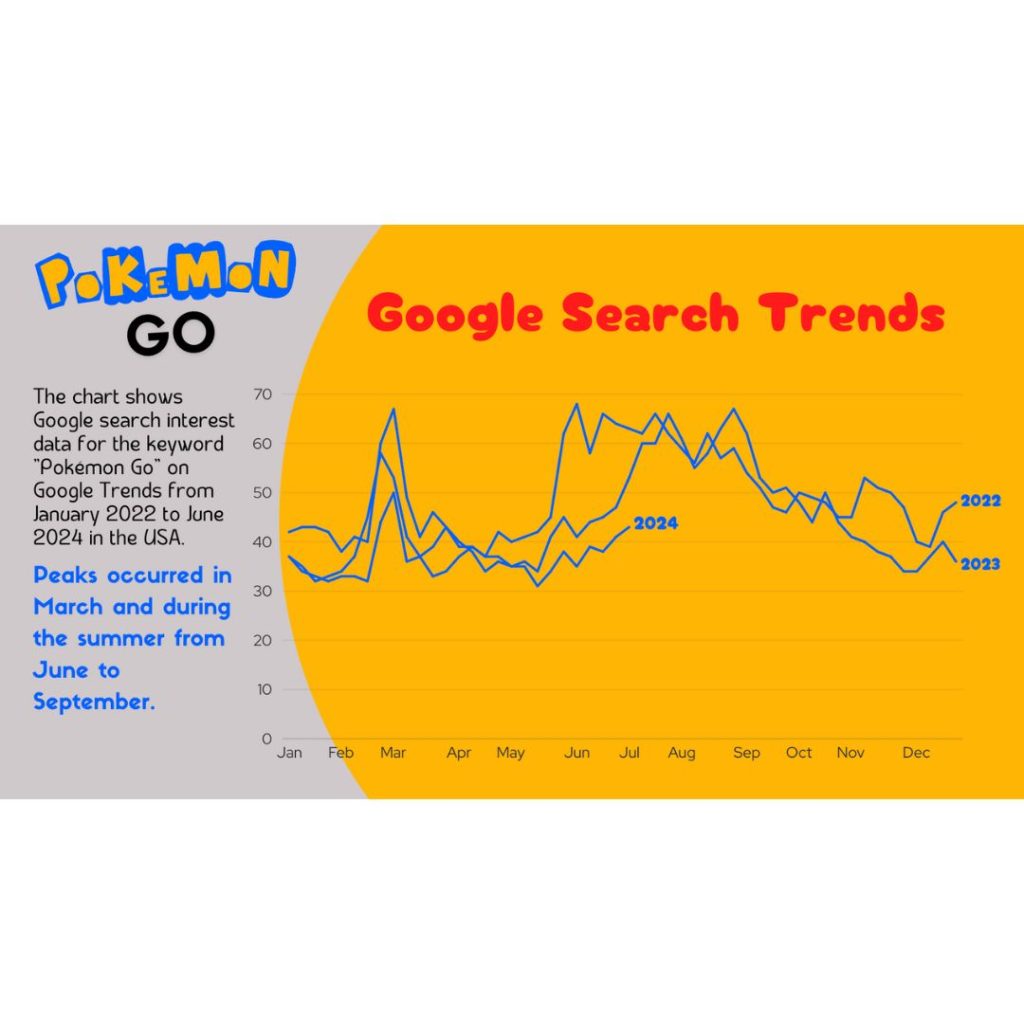
Gotta Graph ‘Em All: Pokémon GO Trends
The chart displays the Google search interest data for the keyword “Pokémon Go” as tracked by Google Trends, covering the period from January 2022 to June 2024 in the United States.
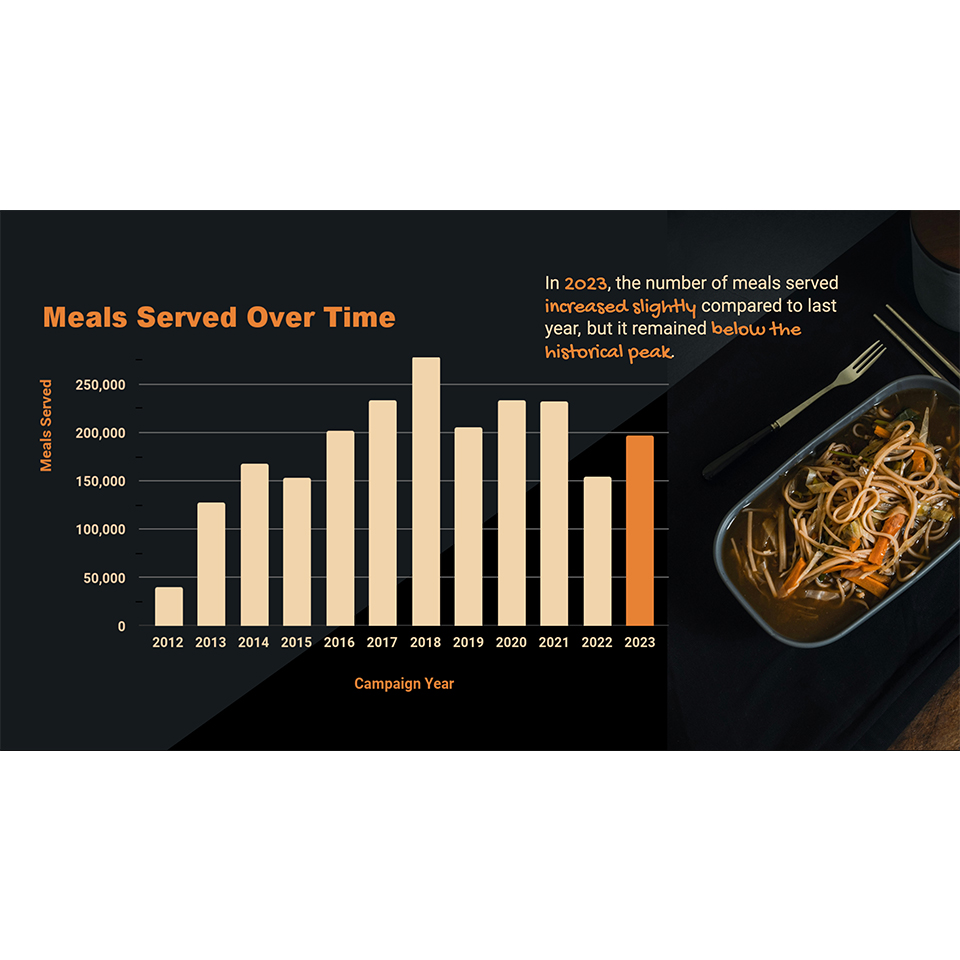
Noddle Over the Number of Meals Served
I stumbled upon this noodle image on Unsplash website and decided to incorporate its colors into the graph. To take it a step further, I adjusted the background of the entire slide to complement the image’s background, giving the visualization a bold and eye-catching look. See all Visualizations
See all Visualizations & Reports
About Me
Master’s in Electrical Engineering (KAIST) | Current: Grants & Contracts Specialist | Passionate about transforming data into insights