Indonesia’s IDA Journey: An SQL Analysis
SQL analysis focuses on IDA funding for Indonesia using 500 MB+ of IDA statement data to examine various aspects, from funding amount, projects, as well as the repayment duration.
SQL analysis focuses on IDA funding for Indonesia using 500 MB+ of IDA statement data to examine various aspects, from funding amount, projects, as well as the repayment duration.

Explore a database of over 2,000 rows of customer data to uncover the key differences between those who accepted the campaign and those who didn’t. These insights will help to enhance future campaigns for greater success!
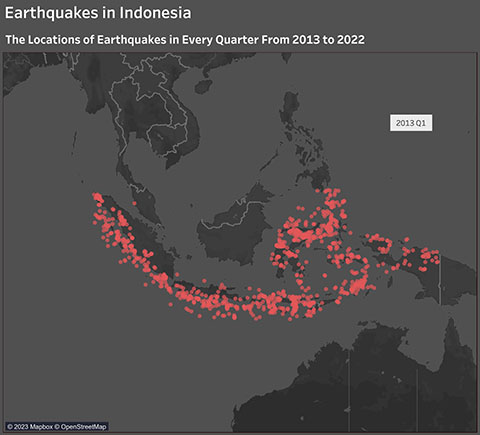
This project aims to create visualizations that showcase Indonesia’s earthquake characteristics from 2013 to 2022, using data from 77,261 seismic events to uncover intriguing patterns and insights.
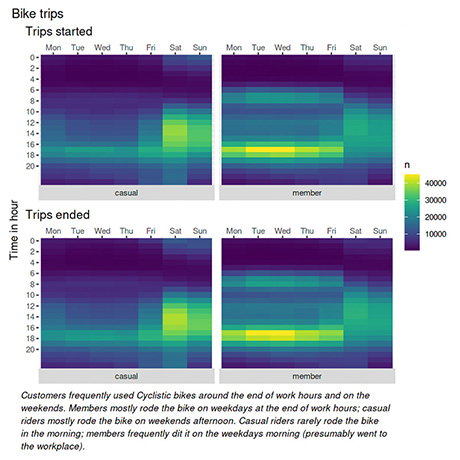
Explore a dataset of over 4 million rows from a year of customer insights to uncover actionable recommendations that will encourage casual riders to purchase a membership.