As part of the Google Data Analytics Capstone, this case study provides recommendations for Cyclistic, a hypothetical bike-sharing company, to encourage their casual riders to purchase an annual membership.
The Problem
Cyclistics has two customer groups: casual riders who purchase single-ride or full-day passes and members who pay annually. The company wants to convert casual riders into annual members since they generate more profit. To achieve this, the marketing analyst team must first understand the riding behavior of both groups.
Skip to the recommendations >>
The Process
I examined customer behavior data for a period of 12 months, starting from September 2020 to August 2021. The data includes information about the rideable used by customers, the time they used the bike, and the starting and ending locations (including station information, latitude, and longitude). The data also specifies the customers’ groups: casual riders or members.
Before doing any analysis, I performed data cleaning and transformation. Below is the data cleaning process.
- Remove any duplicate
- Confirm the years and months match the filename
- Confirm all station id types are character
- Change all date-time from character to date/time class
- Filter out rows whose starting time is later than the ending time
- Confirm rideable type has a reasonable number of unique values, and those values portray the valid rideable type
- Confirm that there are only two customer groups: member and casual
- Filter out missing values, both NA and empty character
- Complete missing station id or station name
Data transformation:
- Create new columns for the bike trip duration, the day trip started, the day trip ended, the hour trip started, and the hour trip ended
- Create a new column to group the bike trip duration every 10 minutes
- Create a new column to flag whether the trip starts and ends at the same station
- Create a new column for Haversine distance between the starting point (start_lat, start_lng) and ending point (end_lat, end_lng)
- Create a new column for the ratio between the Haversine distance and ride length
- Create two copies of datasets, exclusive for each group of casual riders and members
Next, I compared the behaviors of two customer groups. Specifically, I examined the type of bike they used, when they rode, how long they rode for, and their biking speed.
Recommendations
Below are three recommendations to encourage more casual riders to purchase an annual membership based on the differences in bike trip details between casual riders and members.
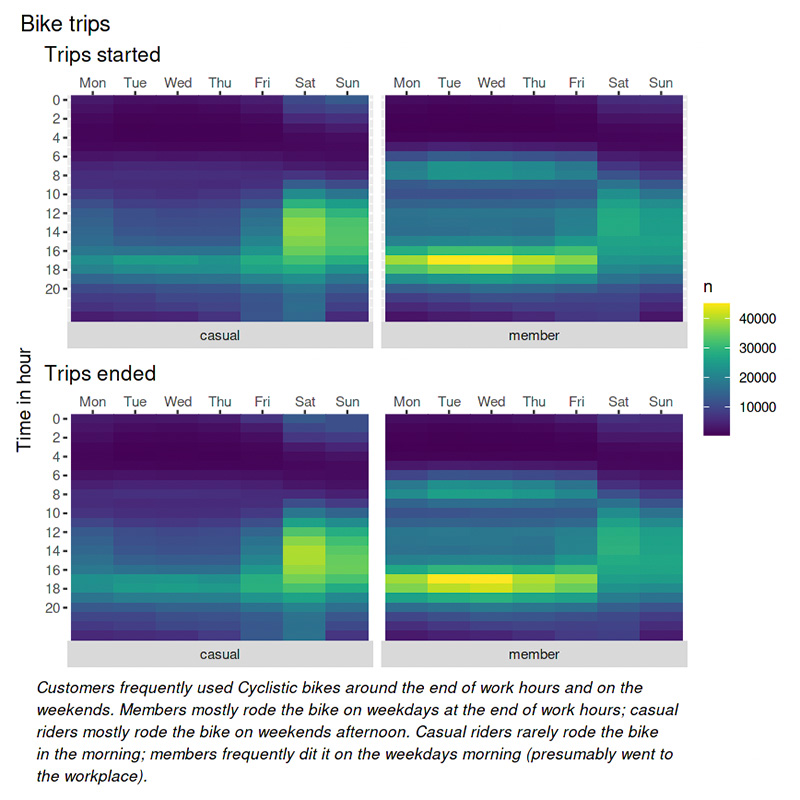
1. Provide more Cyclitics bike-stand close to the office district.
It appears that members frequently used Cyclistic bikes to commute to and from the office, as they were often seen riding them before and after work hours.
The Difference of Members and Casual Riders Based on The Time Their Trips Started and Ended is in the images below.
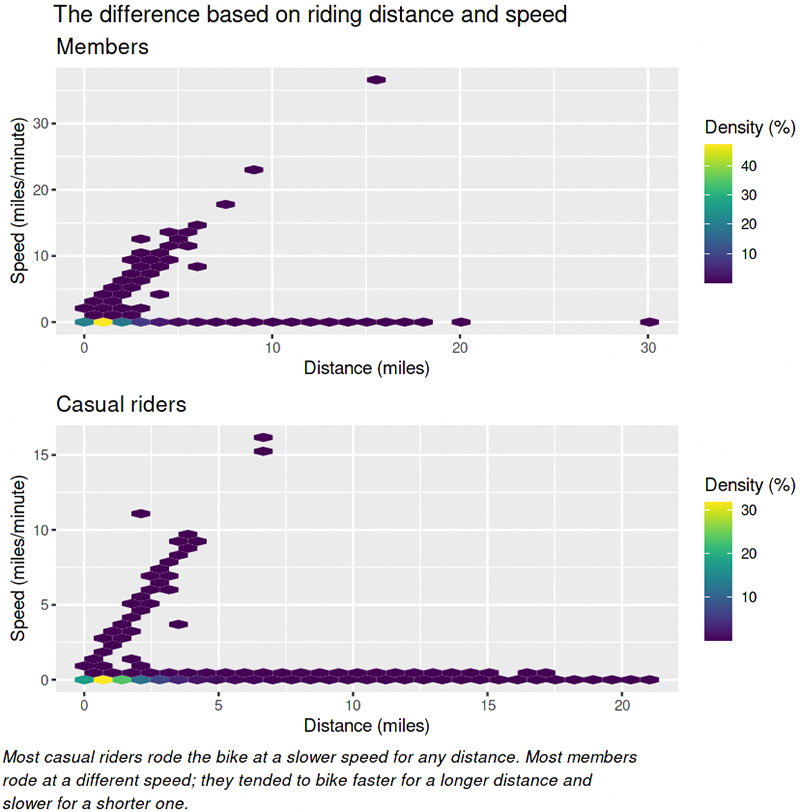
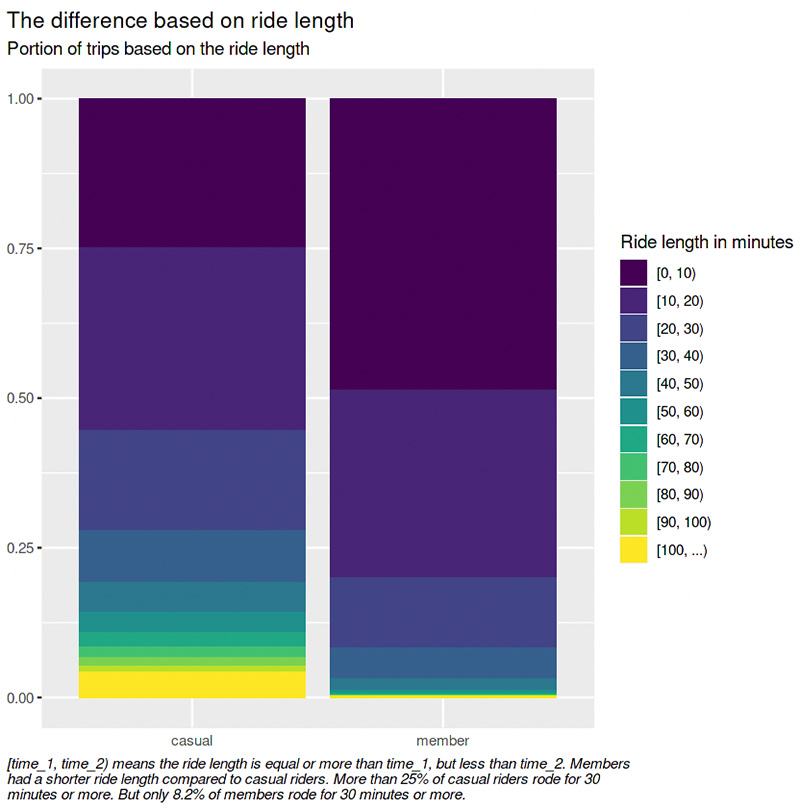
2. Decrease the distance between Cyclistic bike-stand to easily return the bike after a short ride.
Members usually do a short ride based on the customers’ ride length.
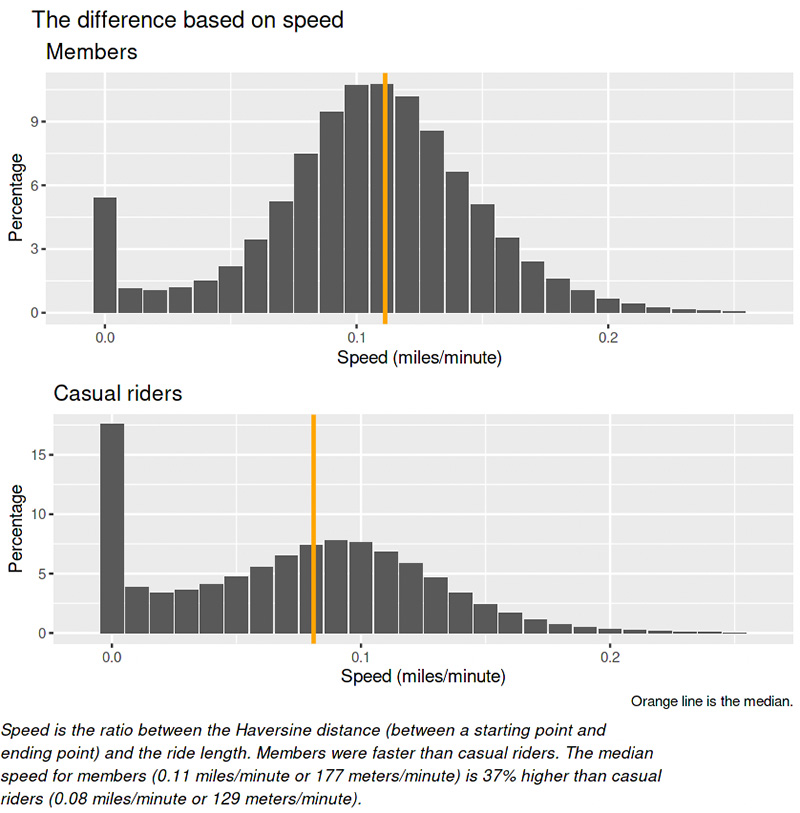
3. Increase the availability of fast-riding bikes, particularly fast-riding classic bikes.
The members preferred classic bikes over other rideable types and rode them at a faster pace than casual riders.