Note: I am not an earthquake expert. I conducted this work out of curiosity and to improve my data analysis skills.
Indonesia experiences frequent earthquakes, with almost daily quakes measuring around five on the Richter scale. While these earthquakes typically do not cause significant damage, they are a fascinating natural phenomenon worth exploring. source source
Understanding the characteristics of earthquakes is crucial, especially for developers looking to expand their real estate portfolio in new regions. By anticipating the risks, they can plan the materials and designs accordingly. Although earthquake insurance is not very popular in Indonesia, the insurance company can also use earthquake data to calculate the risk factor for earthquake insurance premiums.
Table of Contents
Project Objective
The project focuses on creating visualizations to learn the characteristics of earthquakes in Indonesia, specifically their time, location, depth, and magnitude.
Data Source
The data in *.tsv format are publicly available as a Kaggle dataset. It comes from the Earthquake Repository managed by BMKG (Indonesian Meteorology, Climatology, and Geophysical Agency).
When I worked on this project, the dataset comprised 102,515 rows and 38 variables. These variables include eventID, datetime, latitude, longitude, magnitude, depth, location, agency, and more. Most variables are in float format, with only a few in integer or object format. A detailed description of the variables is available here.
Below are some interesting findings from the raw data, and you can find a complete descriptive analysis of the data in my Kaggle notebook.
- Of the 56 regions, Minahasa Peninsula – Sulawesi has the highest recorded earthquakes.
- On average, the recorded earthquakes occurred at approximately 51.5 km depth, with a median of 16 km depth.
- The average magnitude of the recorded earthquakes is around 3.61, whereas the median magnitude is 3.55.
Data Cleaning and Restructuring
I completed the data cleaning and restructuring task using Python in Kaggle notebook. Below is a list of the data-cleaning and restructuring steps I performed.
- Converting the datatype of the datetime variable from object to datetime.
- Adding five columns related to datetime: date, year, month, week, and hour.
- Removing all variables irrelevant to the project objective.
- Dealing with missing values. We have missing magnitude, mag_type, and location values in this project. To maintain accuracy, I removed rows with missing magnitude and mag_type rather than making assumptions to fill them in. Yet, I relied on the complete information in the latitude and longitude variables to fill in any missing location.
- Confirming no duplicated rows.
- Addressing the outliers. The earthquake data has outliers in depth and magnitude variables; the depths range from 0 to 750km, and the magnitudes vary from 0.6383540561 to 7.9234722. However, the most powerful earthquake ever recorded had a whopping magnitude of 9.5. And earthquakes can occur as deep as 800km. Therefore, I retained all outliers values for both magnitude and depth since a maximum magnitude of 7.9 and a maximum depth of 750km in the dataset are reasonable.source source
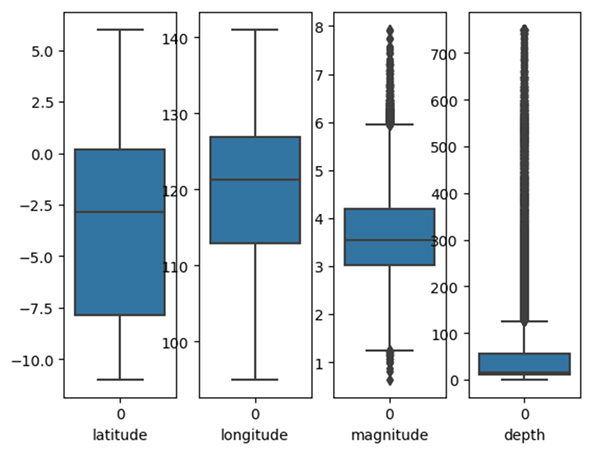
- Categorizing magnitude and depth variables.
Key takeaways from cleaned dataset
After cleaning and restructuring the data, we ended up with 102,003 rows and 12 variables. Below are the main points to take away from the cleaned data, and for a detailed descriptive analysis, please refer to Kaggle notebook.
- Data was recorded from November 1, 2008, to April 15, 2023, covering approximately 14 years.
- Out of 56 locations, the Minahasa Peninsula in Sulawesi has experienced the highest number of recorded earthquakes.
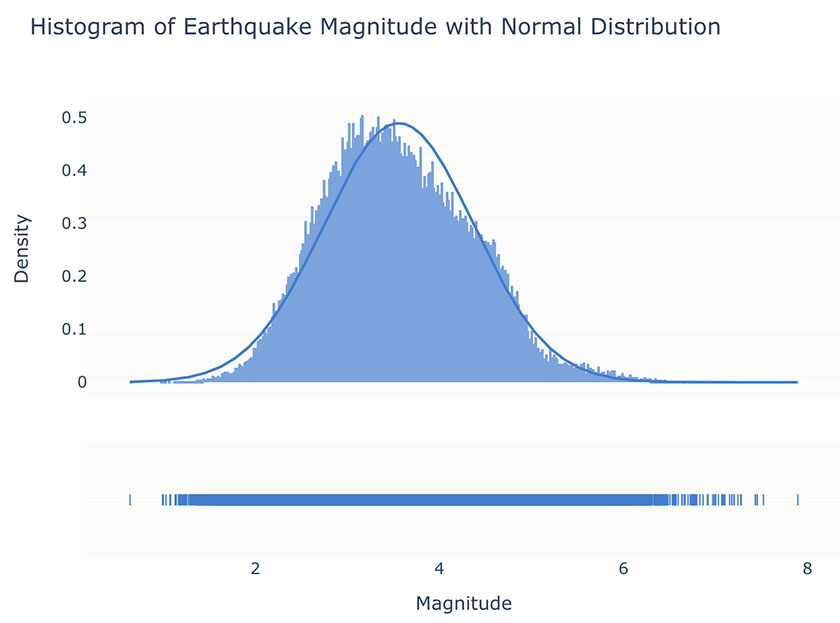
- Earthquake magnitudes in the cleaned dataset ranged from 0.64 to 7.92, with a median of 3.55.
- Earthquake depths in the cleaned dataset are between 0 and 750 km, with a median depth of 16 km.
Results and Evaluation
For the evaluation, I only assess data from January 1, 2013, to December 12, 2022, which spans ten years.
The graphs in this section are created using the Plotly Express library in Python. To view the charts interactively, please refer to the Kaggle notebook.
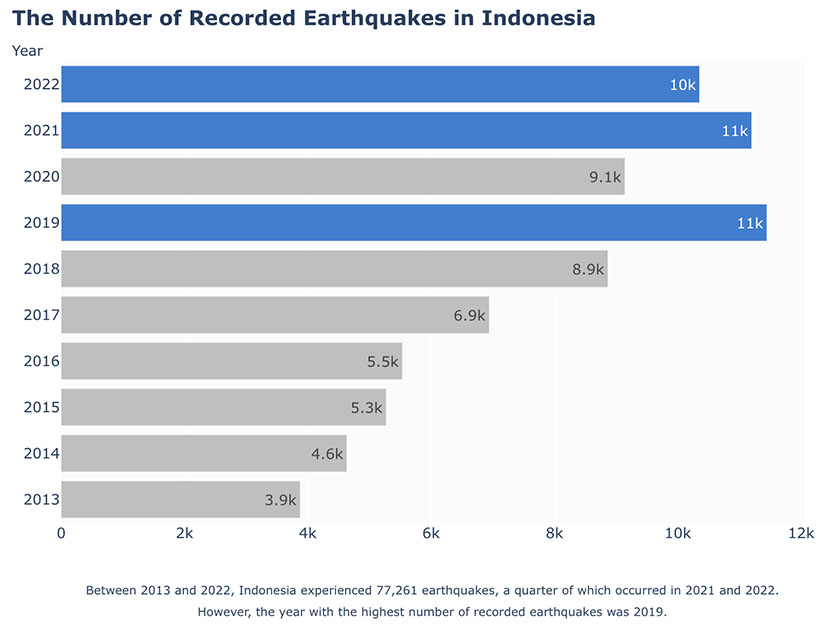
1. The number of recorded earthquakes in Indonesia from 2013 to 2022
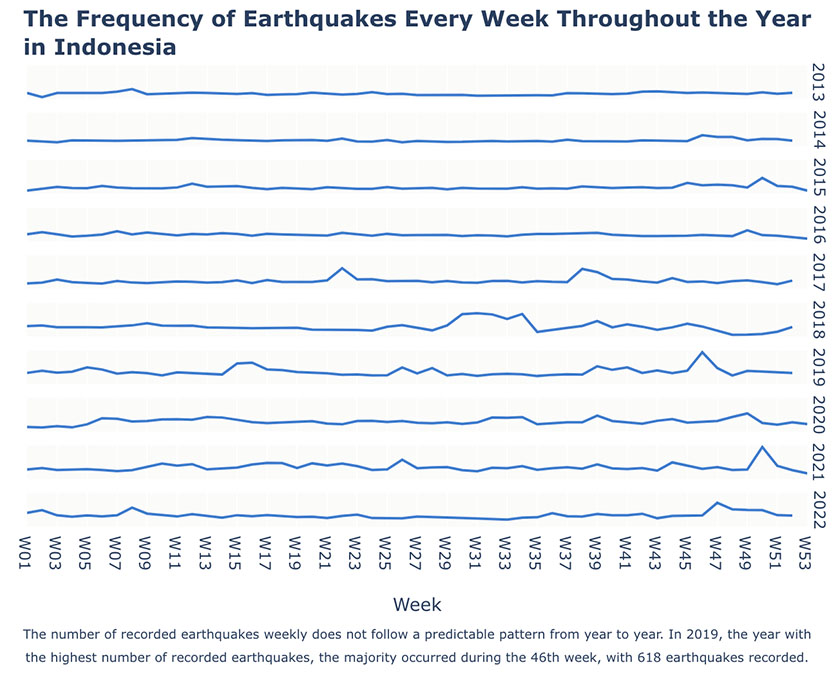
2. Weekly frequency of earthquakes between 2013 and 2022 in Indonesia
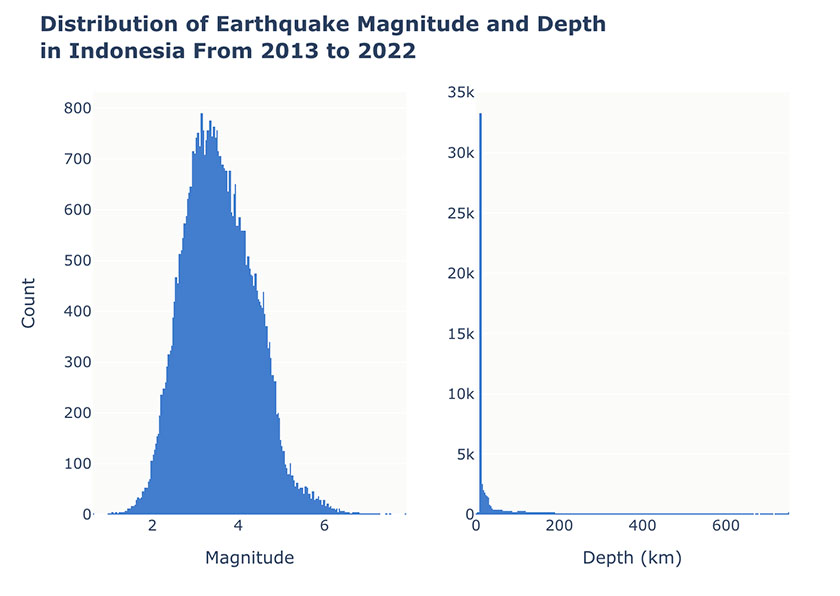
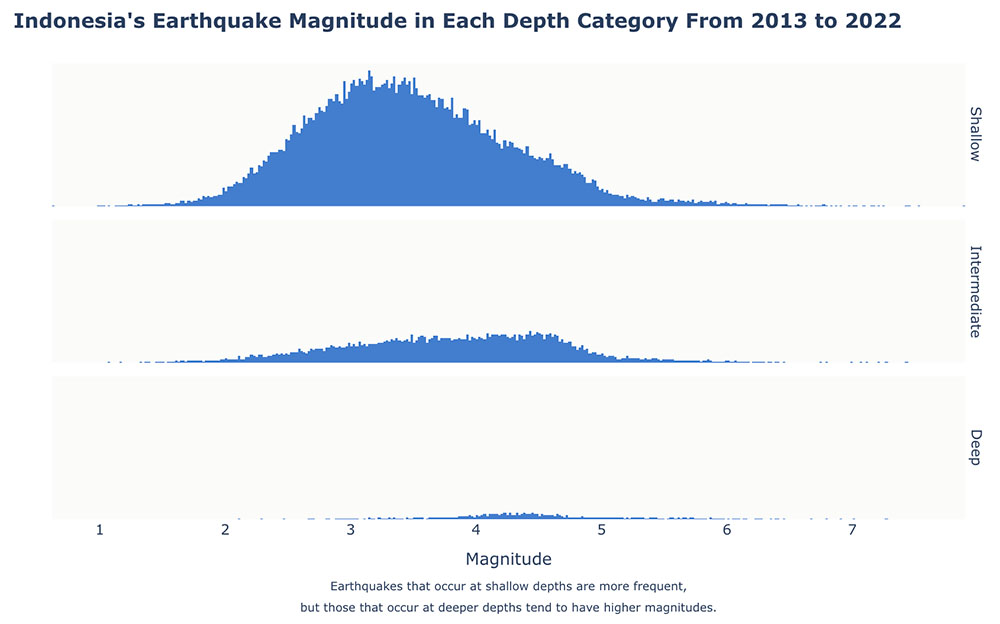
3. Indonesia’s earthquake magnitude and depth distributions from 2013 to 2022.
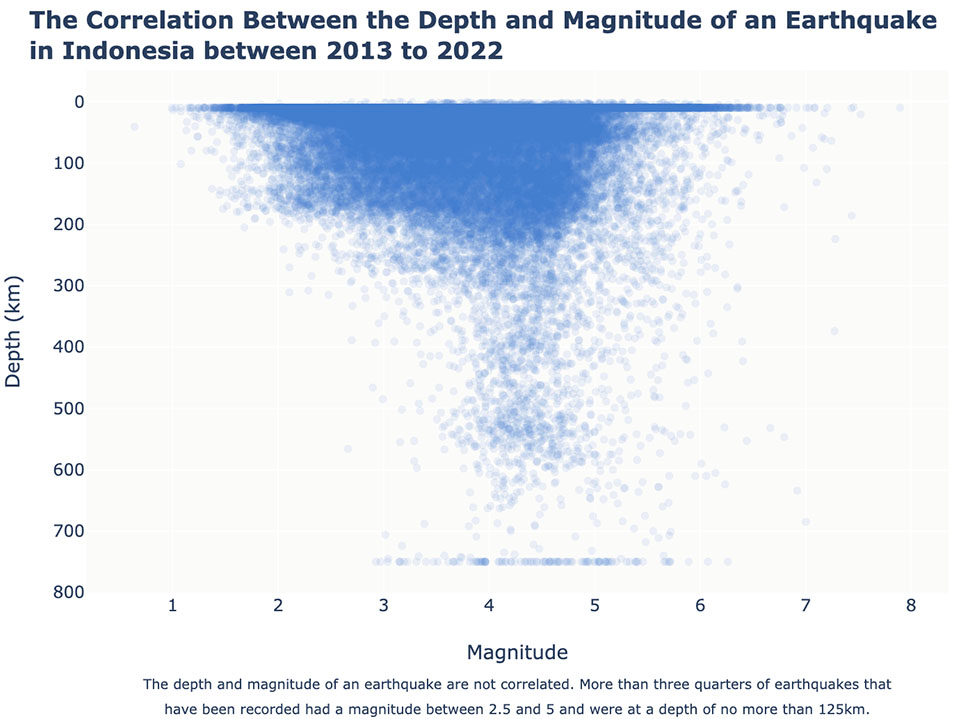
4. The correlation between the depth of an earthquake and its magnitude
5. The frequency of earthquakes that recorded in different parts of Indonesia between 2013 and 2022
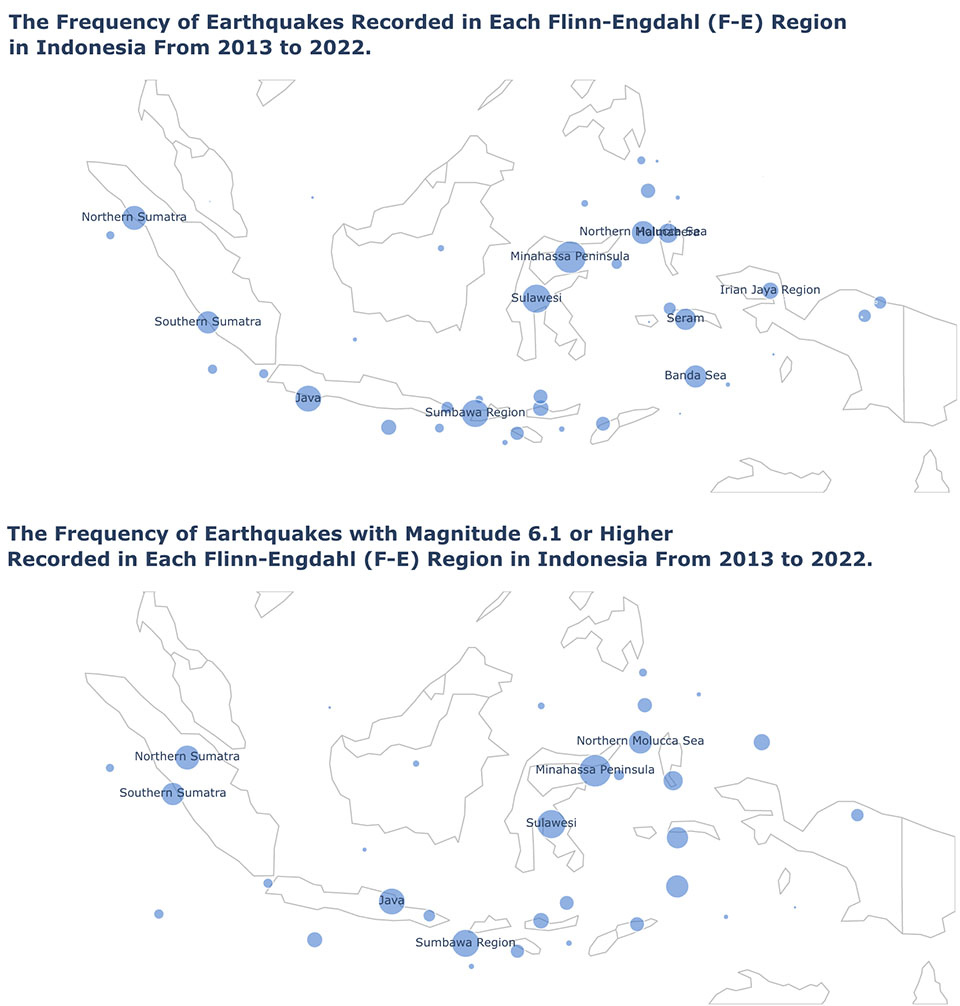
The dataset includes 56 earthquake zones, known as F-E regions. The size of the bubbles on the map indicates the number of earthquakes in each region. Between 2013 and 2022, the area with the highest number of earthquakes was the Minahasa Peninsula.
The map on the top shows the frequency of all earthquakes recorded between 2013 to 2022, while the map on the bottom shows the earthquake with a magnitude of 6.1 or higher. In highly populated areas, an earthquake measuring 6.1 on the magnitude scale can potentially result in significant damage.source
The two maps above show similar bubble sizes for each region, but the positions of the bubbles are different. The bubbles represent the median latitude and longitude of all earthquakes in each region. In the bottom map, the median location of earthquakes in the Minahasa Peninsula region is shifted to the east, suggesting that more damaging earthquakes mainly occurred around the eastern side of the Minahasa Peninsula, near the Molucca Sea.
6. The earthquakes location based on latitude and longitude
I used Tableau to visualize the locations of earthquakes based on their latitude and longitude. You can watch a screen recording below that shows the animation of the earthquake locations every quarter.
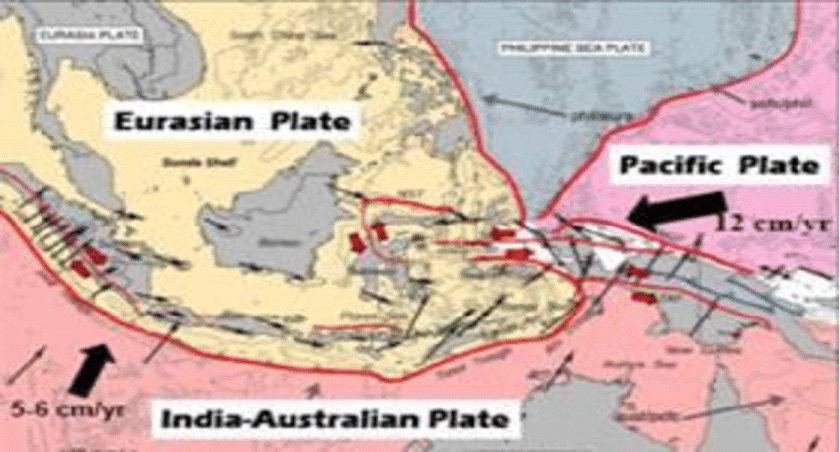
The video above illustrates that the earthquakes in Indonesia primarily took place at the meeting point of tectonic plates, represented by the red lines in the figure below.
Key takeaways from evaluation
- From 2013 to 2022, the year with the highest number of recorded earthquakes is 2019.
- From 2013 to 2022, more than three quarters of earthquakes that have been recorded had a magnitude between 2.5 and 5 and were at a depth of no more than 125km.
- Between 2013 and 2022, the F-E region with the highest number of earthquakes was the Minahasa Peninsula.
- The earthquakes in Indonesia primarily took place at the meeting point of tectonic plates.