
The complete code can be found in my Kaggle profile.
I used the OpenSky Network API, a free tool that provides live aircraft tracking data, to explore global aircraft activity in a way that’s relevant to business decision-making. Specifically, I looked into which countries had the most tracked aircraft and how many of those aircraft were on the ground at that moment.
I pulled a live snapshot of aircraft state data from OpenSky’s /states/all endpoint, covering aircraft tracked globally at that moment. A live snapshot means the data reflects the aircraft’s positions and status at the exact moment I made the request. It’s not a running history, just a single point in time.
response = requests.get("https://opensky-network.org/api/states/all")
data = response.json()
I identified the top 10 countries by number of tracked aircraft, then looked at the grounded ratio for those same 10 countries. The grounded ratio measures the share of a country’s airplanes that are on the ground instead of flying at a given time. If the ratio is 1.0, it means that every tracked airplane in that country is on the ground. On the other hand, a ratio of 0.0 indicates that all the tracked airplanes are currently in the air.
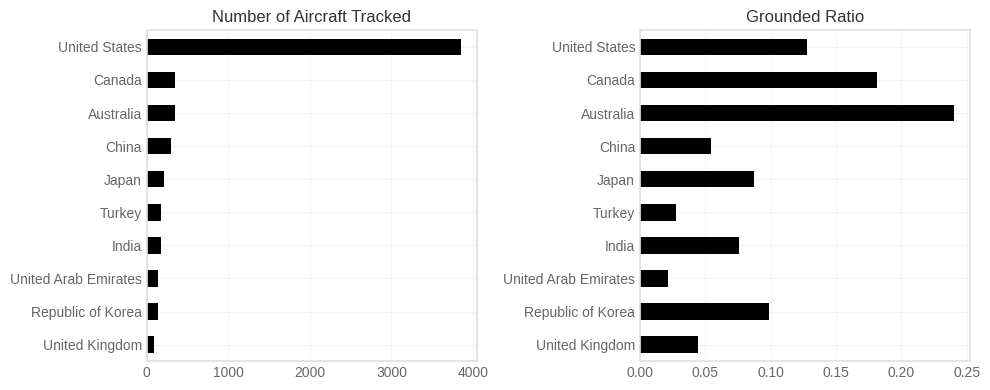
According to OpenSky’s own documentation, their data comes from a volunteer-run network of receivers, with much better coverage in Europe and the United States [link]. This likely explains why the US appears to have far more tracked aircraft than other countries. It may reflect the availability of tracking coverage more than the actual global distribution of flights.
The number of tracked aircraft and the grounded ratio didn’t appear to be related, as observed in the 10 countries with the most tracked aircraft, which showed varied grounded ratios. This suggests that whatever drives a high grounded ratio at any given moment, whether maintenance schedules or flight patterns, isn’t simply a function of how many aircraft a country has. The same coverage limitation likely applies here too: grounded aircraft can only be detected by a nearby sensor, so this lack of correlation may say as much about where sensors happen to be placed as it does about any real-world pattern.
Why this matters
Aircraft that are grounded rather than flying are often undergoing maintenance, turnaround, or repair, which is exactly when the demand for parts is highest. In theory, a country with a large tracked aircraft and a significant share of its fleet grounded at any given time could hint at where maintenance activity is concentrated. For a business like an aircraft parts e-commerce marketplace, this kind of regional thinking is worth having.
But given the detection coverage limitations that depend on nearby sensors, a country showing a large tracked aircraft or a particular grounded ratio may simply reflect where OpenSky happens to have receivers, not the true number of its aircraft activity or maintenance patterns. A more dependable way to use this approach would be to combine it with a data source that isn’t affected by how volunteers place their sensors. Another option is to observe the same countries over time to see whether the trends remain consistent, rather than relying on a single dataset.