Following my analysis of financial data, I am advancing my journey with Data Career Jumpstart to enhance my SQL analytical skills. My focus is now on utilizing these skills to analyze data within the healthcare sector.
Key Takeaways
Over a 10-year period, data were collected from 101,766 hospital admissions of diabetic patients in the US. The following criteria were met for these admissions: the encounter was classified as a hospital admission, a type of diabetes was recorded as a diagnosis, the length of stay ranged from 1 to 14 days, laboratory tests were conducted, and medications were administered.
From this data, I learned that:
- The most common admission was emergency admission from the emergency room, accounting for 48% of total admissions.
- Emergency admissions from the emergency room are dominated by generalist care (Internal Medicine and Family/General Practice comprising 62%), while elective admissions from physician referrals show greater specialty diversity, with Cardiology, Orthopedics, and General Surgery leading at only 36% combined.
- The risk of diabetes hospitalization increases with age.
- Hispanics and Asians were underrepresented in hospital admissions, with each group’s share of admissions at approximately one-sixth of their respective US population shares.
- Patients with more than 10 prior inpatient visits showed over 50% readmission within 30 days, while those with 1 or less visit had over 50% with no readmission.
Understanding Diabetes
Diabetes is a chronic disease that occurs either when the pancreas does not produce enough insulin or when the body cannot effectively use the insulin it makes. There are two main types of diabetes: Type 1 and Type 2. Type 1 diabetes results from inadequate insulin production, while Type 2 diabetes impairs how the body processes glucose due to insulin resistance and eventual decline in insulin production. [1, 2]
Currently, around 589 million adults worldwide have diabetes [3]. In the U.S., more than 38 million people are affected, which is about 11% of the population [3, 4]. Diabetes can lead to serious health problems like blindness, kidney failure, heart disease, stroke, and amputation [5]. In fact, it was one of the top 10 causes of death worldwide in 2021 [6].
Data
I was working with a dataset from the course, originally sourced from the UC Irvine Machine Learning Repository. The dataset covers ten years (1999-2008) of clinical care data from 130 US hospitals and integrated delivery networks, featuring over 50 patient and hospital outcome variables. Data were extracted for inpatient encounters that met the following criteria: the encounter was a hospital admission, a type of diabetes was recorded as a diagnosis, the length of stay was 1-14 days, laboratory tests were performed, and medications were administered. [7]
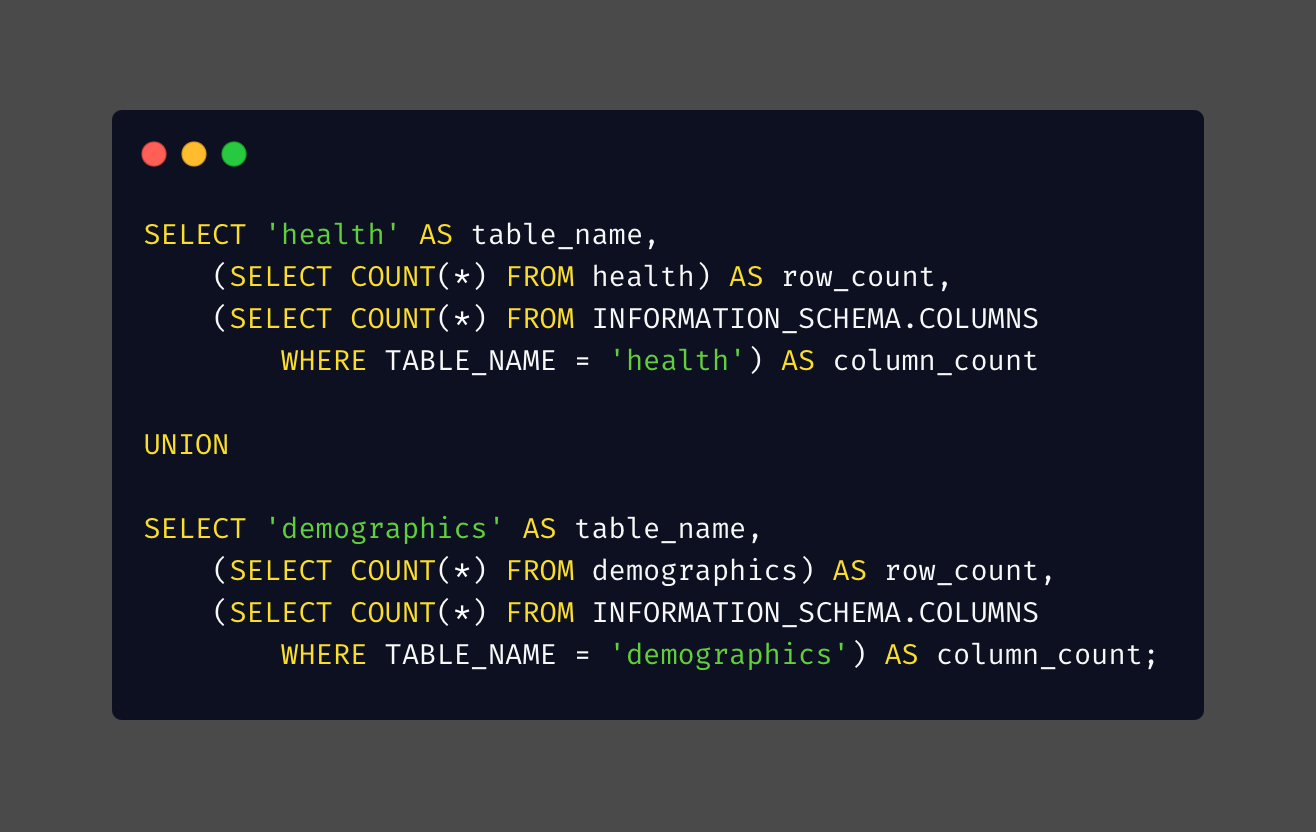
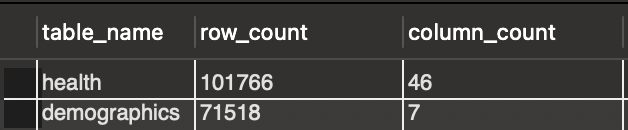
There are two tables in the data: the first is a health table containing information on 101,766 hospital admissions, including various health-related details. The second part is a demographics table containing information on 71,518 patients.
Analysis
All analyses were conducted using MySQL Workbench, and Carbon was used to display codes appealingly. For clarity, some query results were visualized in Google Sheets for easier readability.
Before starting any analysis, I wanted to make sure that the patients in both tables are the same. There are two steps I checked this:
1. Confirmed the same number of patients in each table
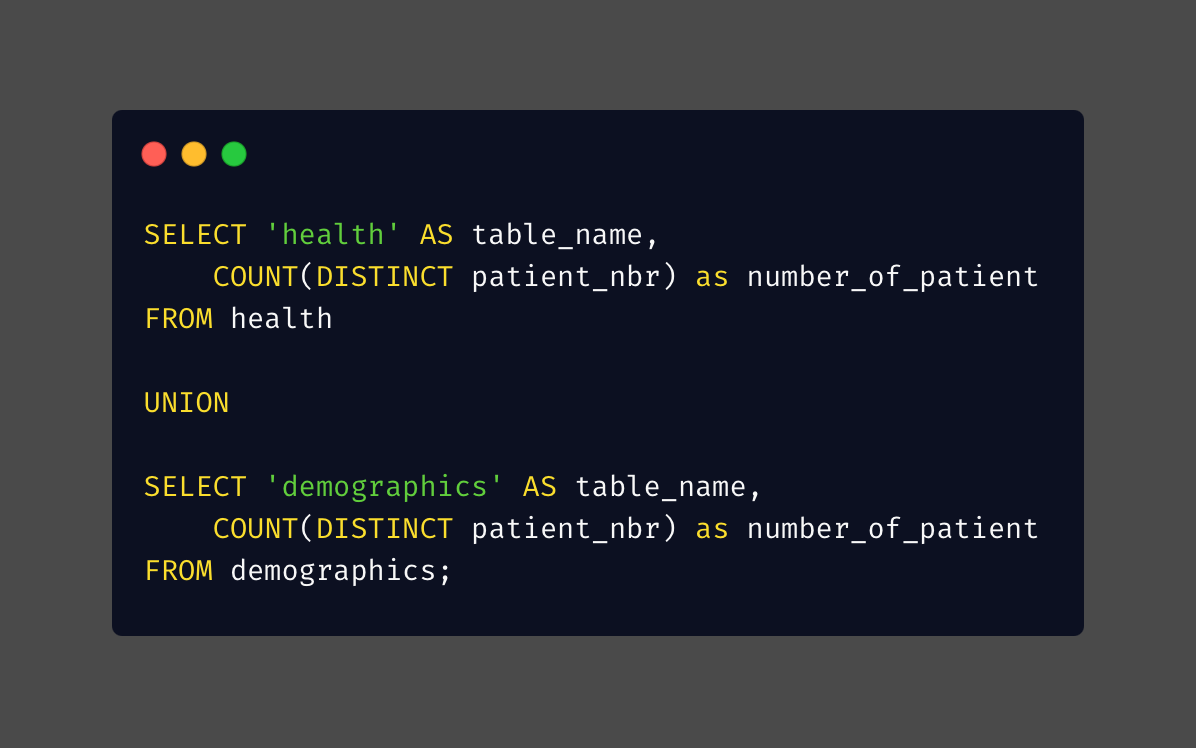
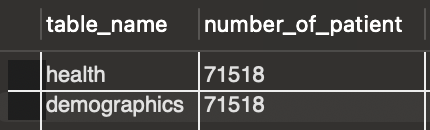
2. Made sure all patients show up in both tables
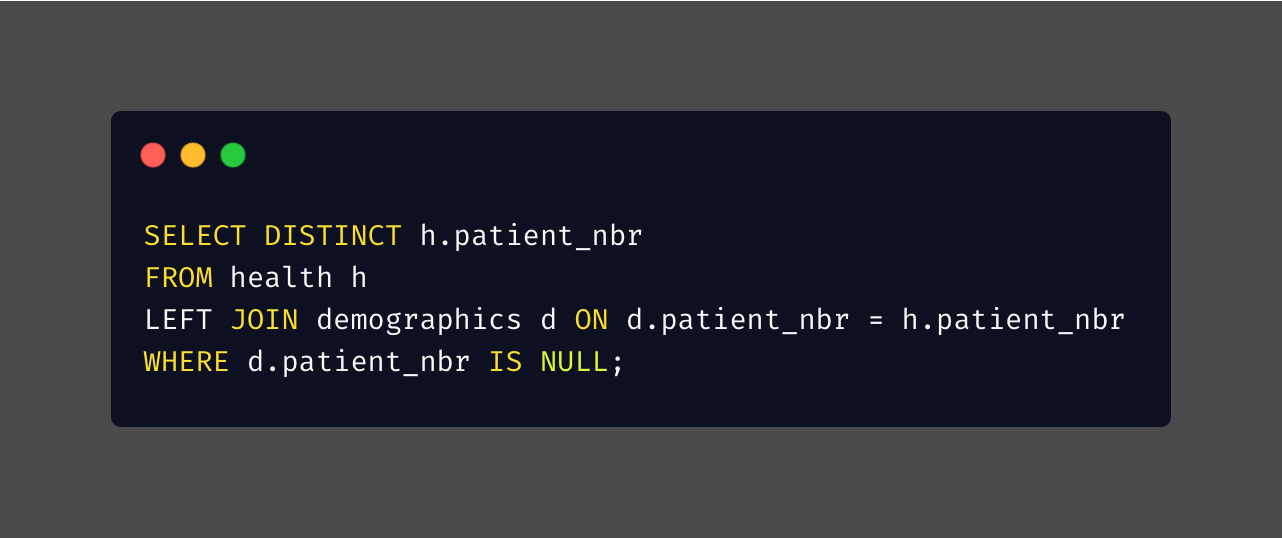

From the 2 steps above, I confirmed that I have the same number of patients in both tables, and that, based on their IDs, both tables include the same patients.
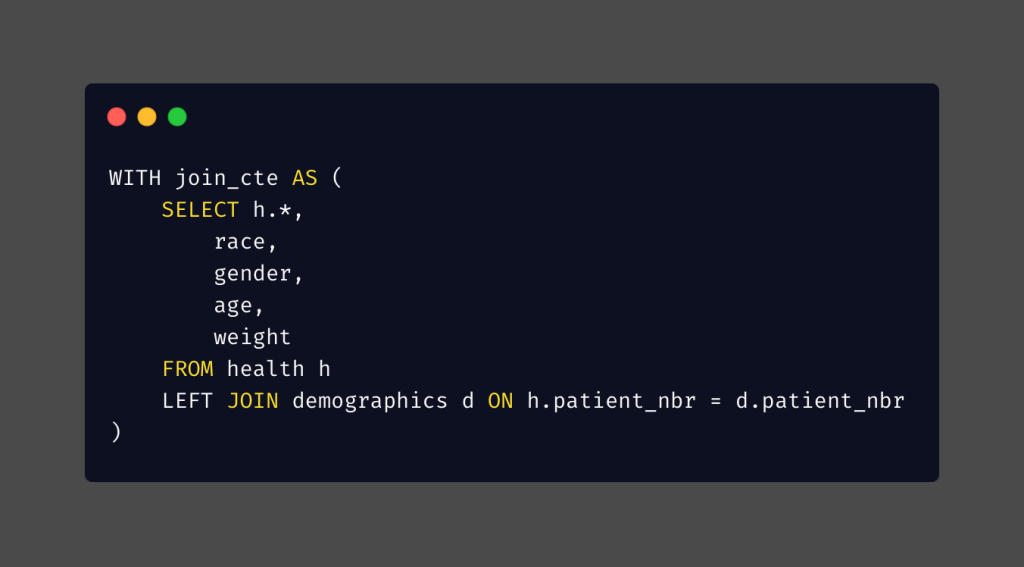
Now, I can confidently combine these 2 tables using LEFT JOIN. I included all columns in the health table but excluded 2 columns in the demographics table: rowNumber and RID.
A. How Patients Enter the System
A.1. Common Admission Pathways

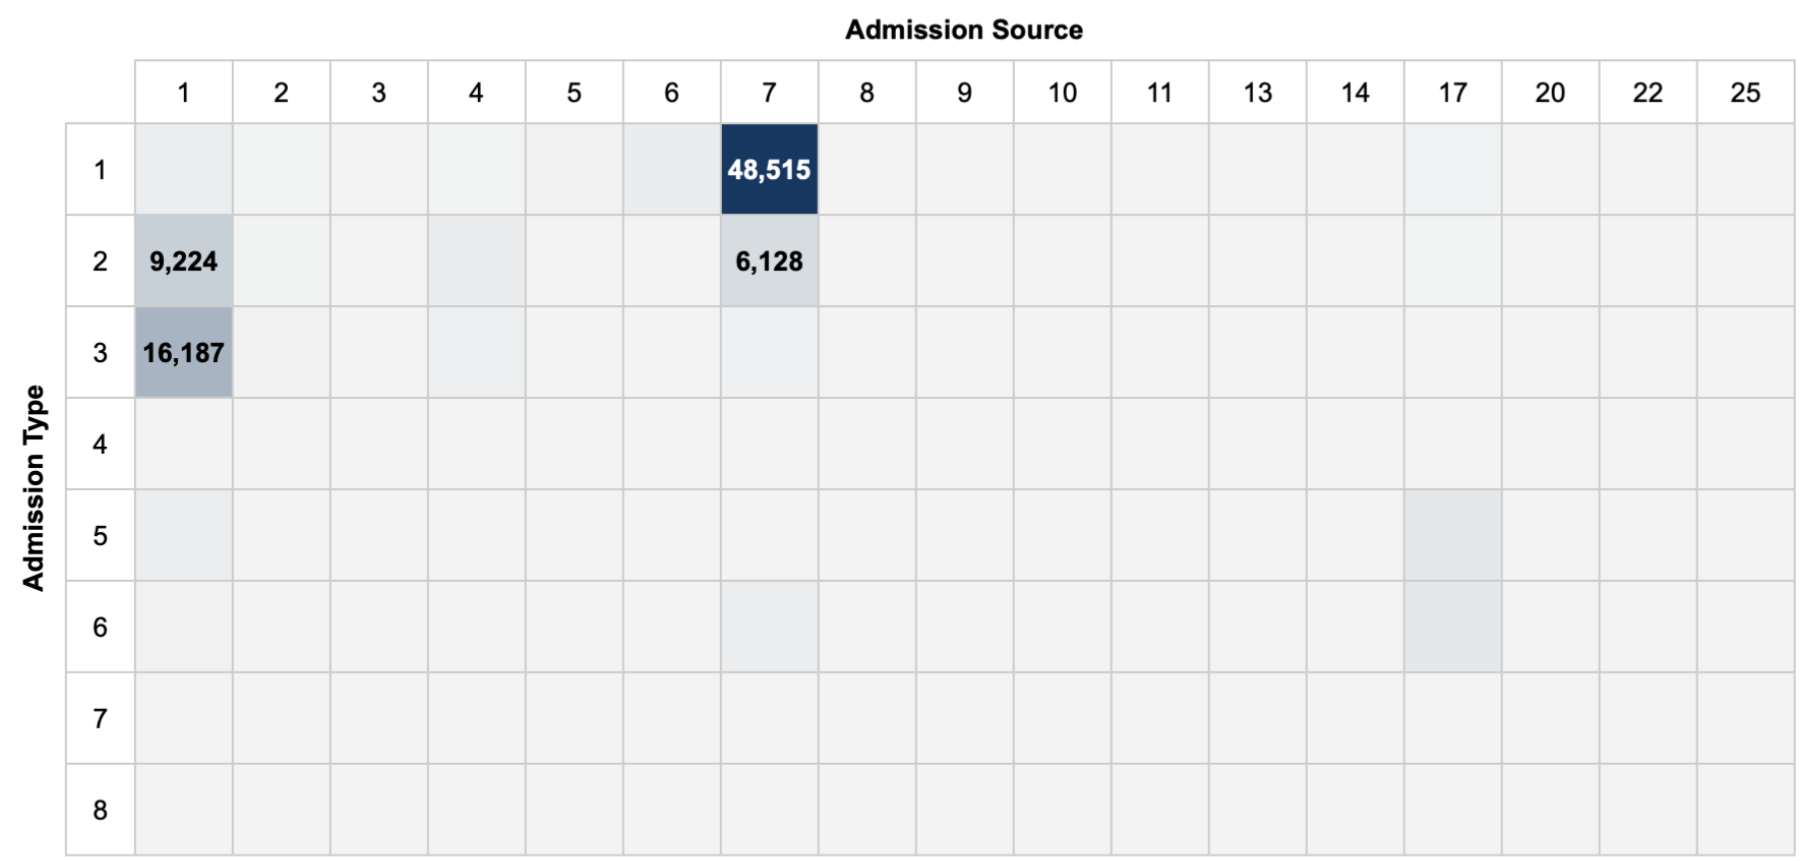
After running the SQL query, I created a heatmap to visualize the results. Cell values are labeled only where frequency exceeds 5% of the total admissions in the dataset.
The corresponding admission types and sources associated with the IDs can be found in the IDS mapping file. [10]
The three most common admission types were emergency (ID=1, 53% of total admissions), elective (ID=3, 19% of total admissions), and urgent (ID=2, 18% of total admissions). And the two highest sources of admission were the emergency room (ID=7, 56% of total admissions) and physician referrals (ID=1, 29% of total admissions).
Analyzing the intersection of admission types and sources, the most common admission was emergency admission from the emergency room, accounting for 48% of total admissions. This was followed by elective admissions from physician referrals, accounting for 16% of total admissions.
A.2. Admission Pathways and Physician Specialties
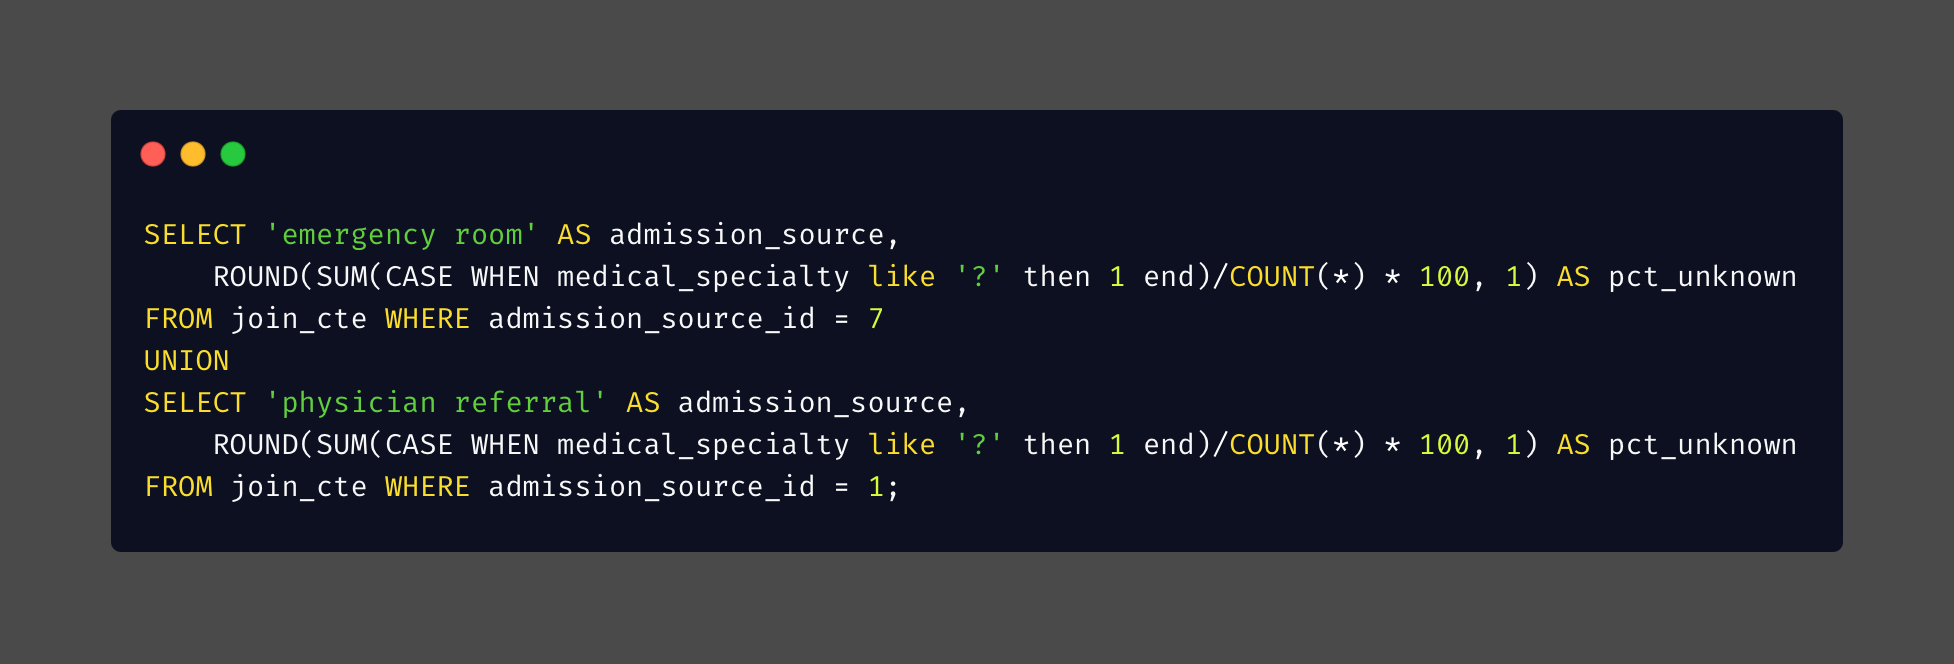
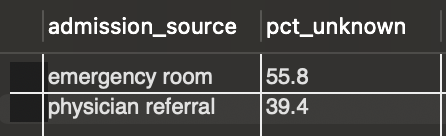
The medical specialty column, which contains information on the admitting physician’s specialty, has numerous missing values, but they are not randomly distributed. Emergency room admissions have significantly higher rates of missing specialty information compared to physician referrals. This suggests that the type of admission may influence whether specialty information is recorded.
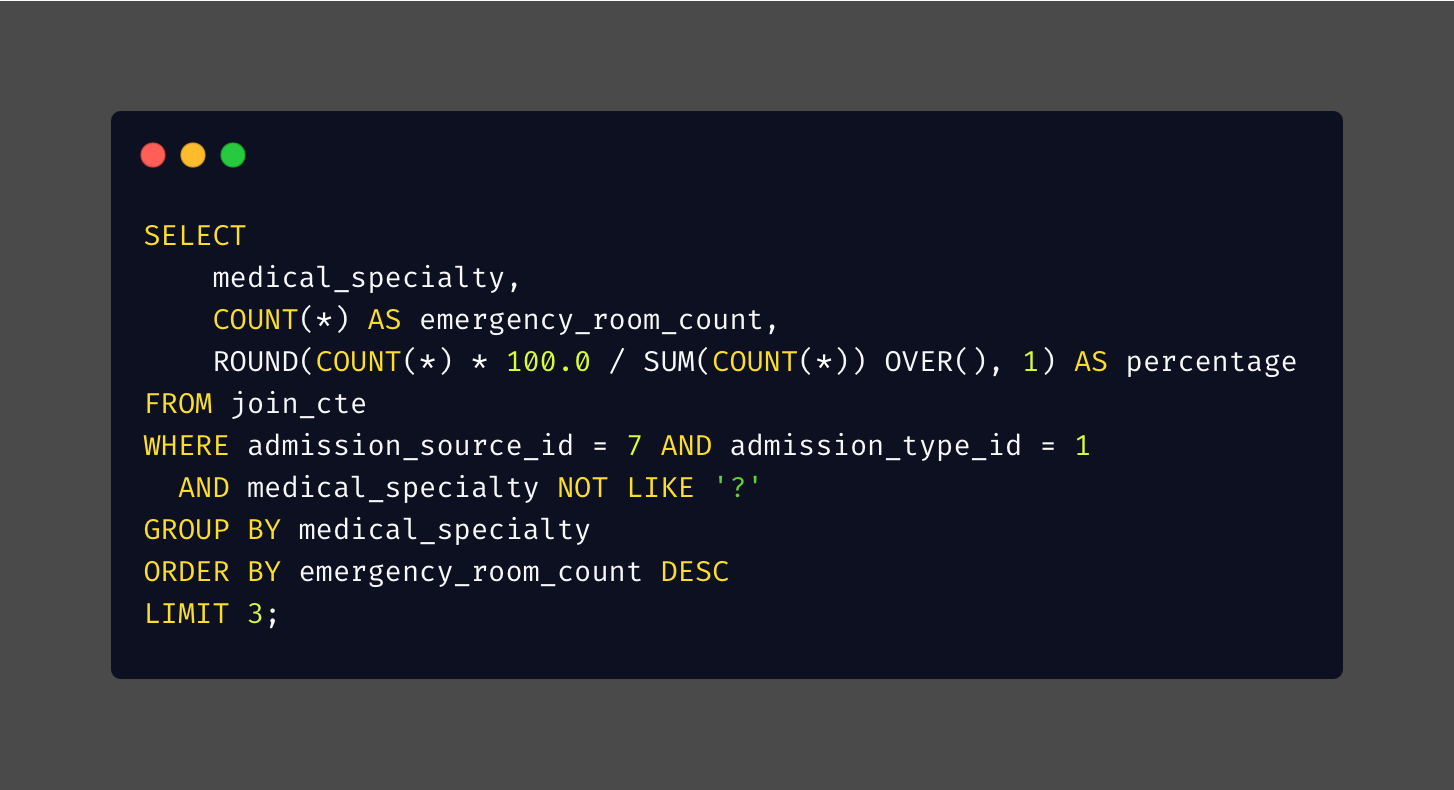
Query for the referral elective count similar to the emergency room count, but changed the admission_source_id and admission_type_id accordingly.
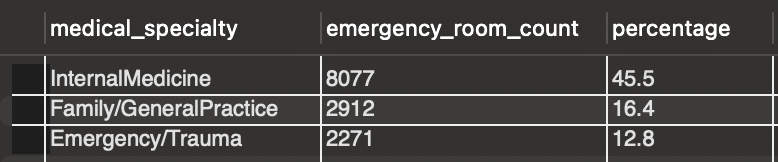
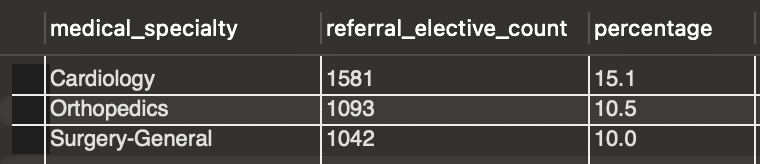
Emergency cases originating from the emergency room admissions show a strong concentration among generalist specialties: Internal Medicine and Family/General Practice together comprise 62% of documented cases, with Emergency/Trauma completing the top three. Physician referrals for elective admissions show a markedly different distribution, with Cardiology, Orthopedics, and General Surgery as the leading specialties, though these three combined account for only 36% of cases, suggesting greater specialty diversity in planned admissions.
B. Demographic Characteristics in Care
The dataset contains information on 3 demographic characteristics: age, gender, and race. First, I examined the distribution of admitted diabetic patients based on these characteristics. And since demographics distributions are more related to each individual than to admissions, the queries were based on the demographics table rather than join_cte. Then, I also analyze readmission patterns by age and race.
In addition to the demographic information, the dataset includes details about people’s weight. However, I chose not to look at this weight information because 97% of the data is missing. Without height information to help fill in the gaps, I cannot determine whether individuals are of normal weight, underweight, or overweight.
B.1. Age
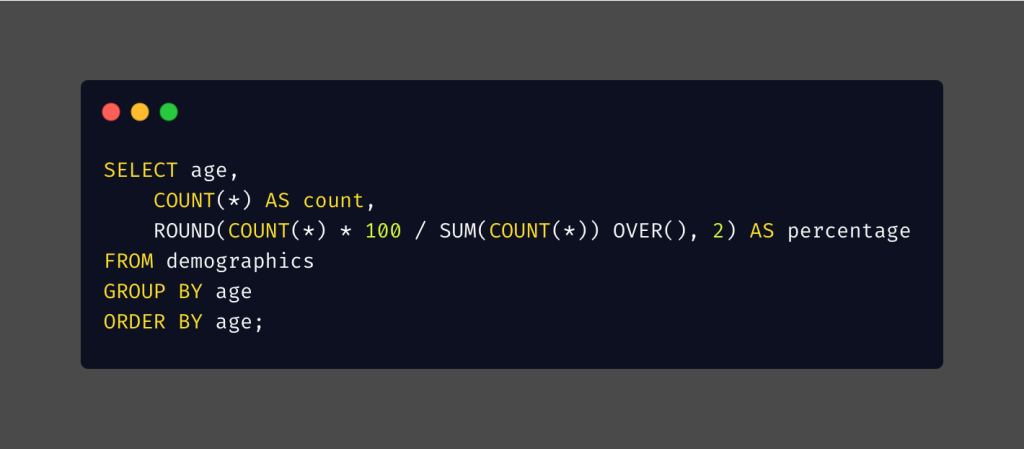
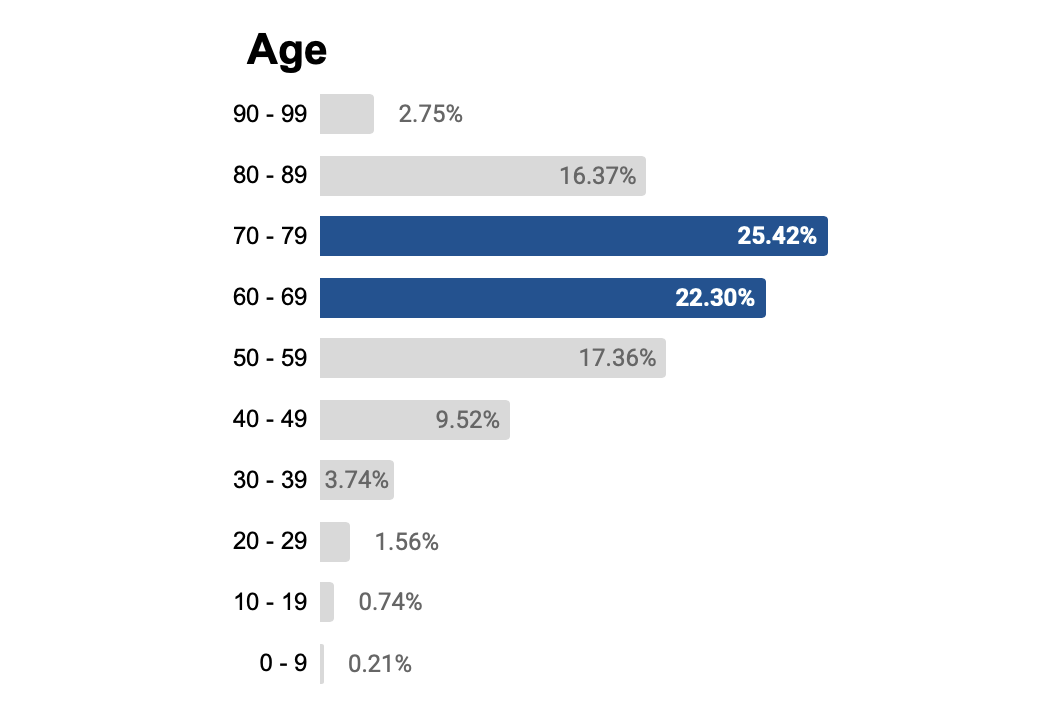
Nearly half (48%) of patients were 60 – 79 years old, despite this age group representing only approximately 13% and 14% of the US population in 1999 and 2008 [8], respectively. The age 80 years old or older group showed even more striking overrepresentation: while their population was approximately ¼ the size of the 60 – 79 group, their admission rate was ⅖ that of the 60 – 79 group. These findings demonstrate that the risk of diabetes hospitalization increases with age.
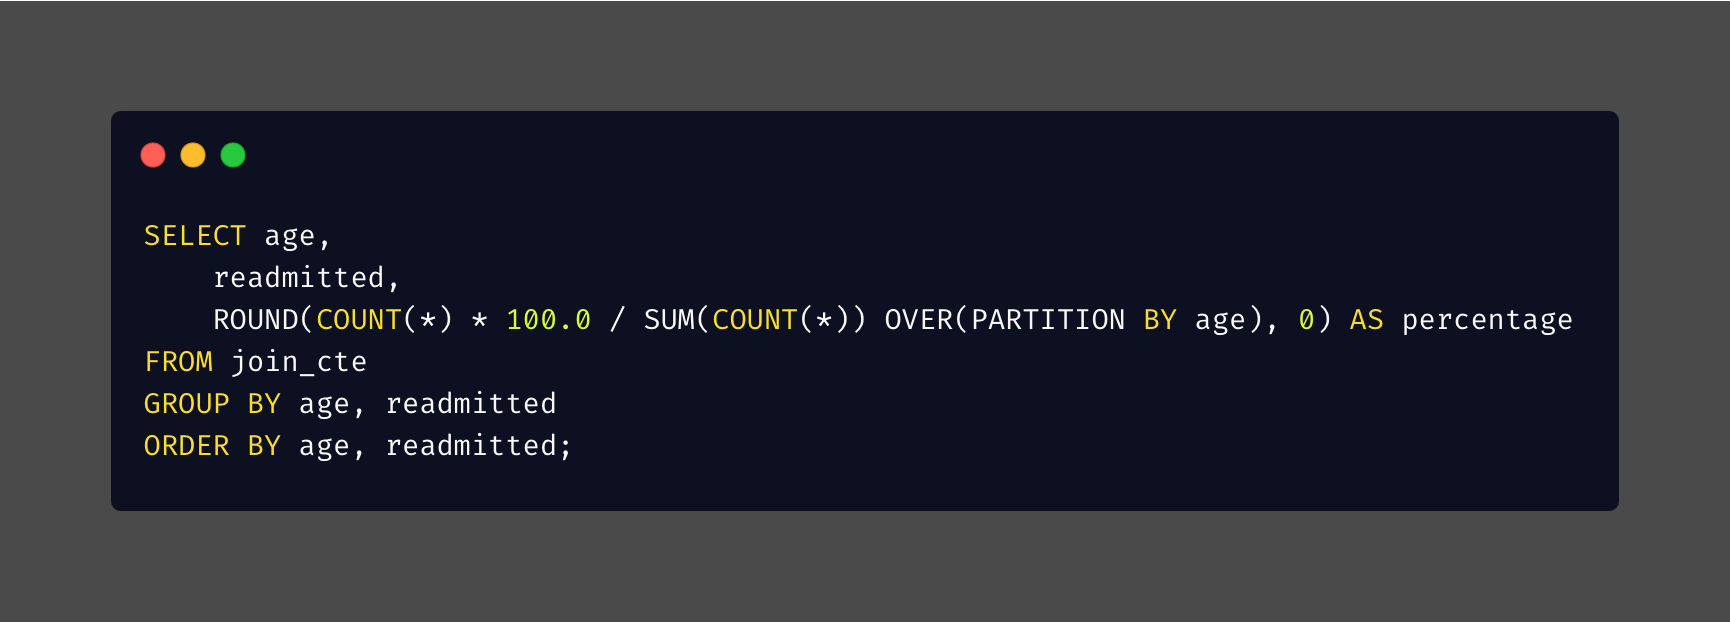
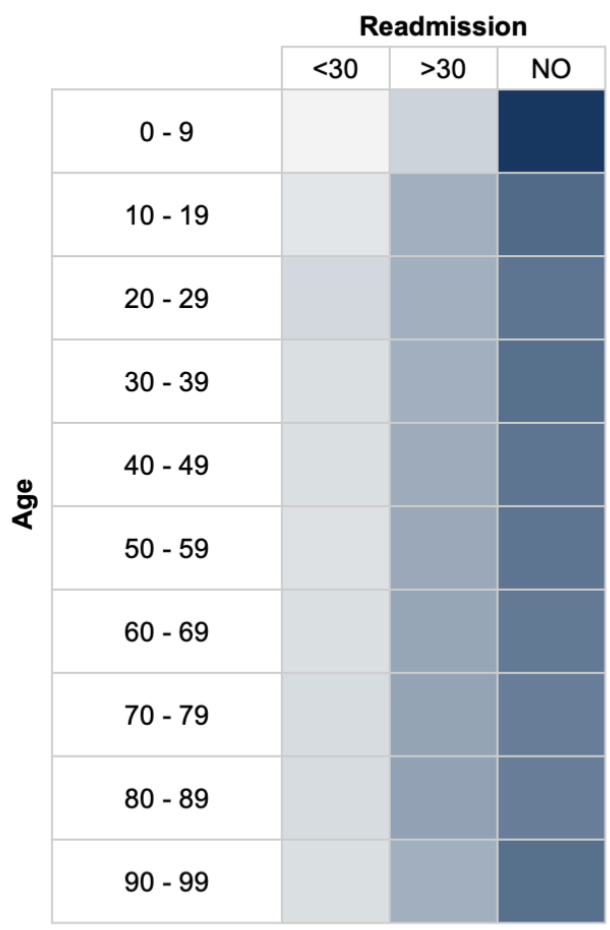
Each row is normalized to 100%, showing the percentage distribution within that row rather than across the entire dataset.
The majority of patients in each age group were not readmitted. The age group 0 – 9 had the highest rate of no readmission. Among those who were readmitted, it typically occurred after more than 30 days.
B.2. Gender
I run the same query as before, but this time I changed the parameter from age to gender.
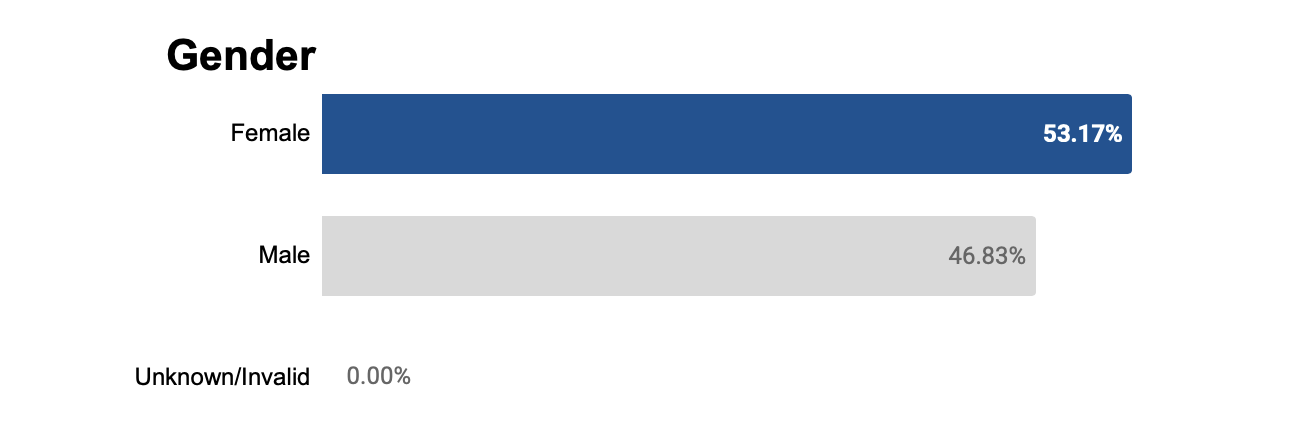
Females have been admitted to the hospital for diabetes more frequently than men. A larger proportion of females was also observed in the population in both 1999 and 2008 [8]. While the difference between females and males who had been admitted was about 6%, in reports from 1999 and 2008 for the overall US population [8], it was less than 2%.
B.3. Race

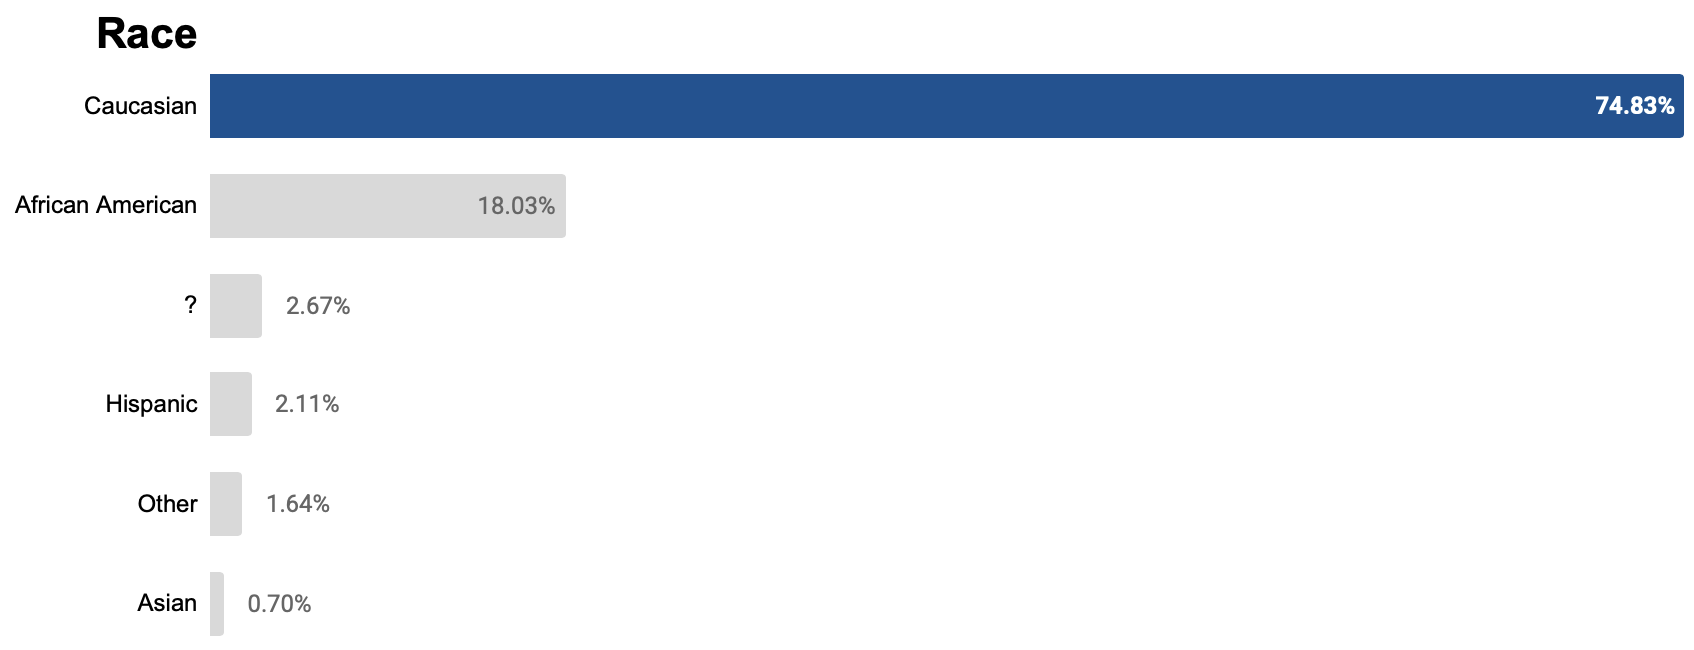
From the query result, I learnt that almost three-quarters of patients were Caucasian patients.
Compared to US population share [8]:
| Race | Diabetic Patients Admitted (%) | US population share in 1999 (%) | US population share in 2008 (%) |
|---|---|---|---|
| Caucasian | 74.83 | 70.7 | 64.8 |
| African American | 18.03 | 12.4 | 12.3 |
| Hispanic | 2.11 | 12.2 | 15.7 |
| Asian | 0.7 | 3.9 | 4.7 |
- Caucasian and African American patients were overrepresented, while Hispanic and Asian patients were notably underrepresented.
- Hispanic and Asian groups had about one-sixth smaller hospital admissions compared to their populations’ share. But, this difference doesn’t automatically mean that the situation is good or bad; it needs to be looked into more closely. Not having enough people represented in healthcare could suggest that they have fewer health issues, that they might not be seeking care as often, or that they prefer other types of treatment to going to the hospital. On the other hand, it could also point to problems such as difficulties accessing services, unmet health needs, or inequalities in the healthcare system itself.
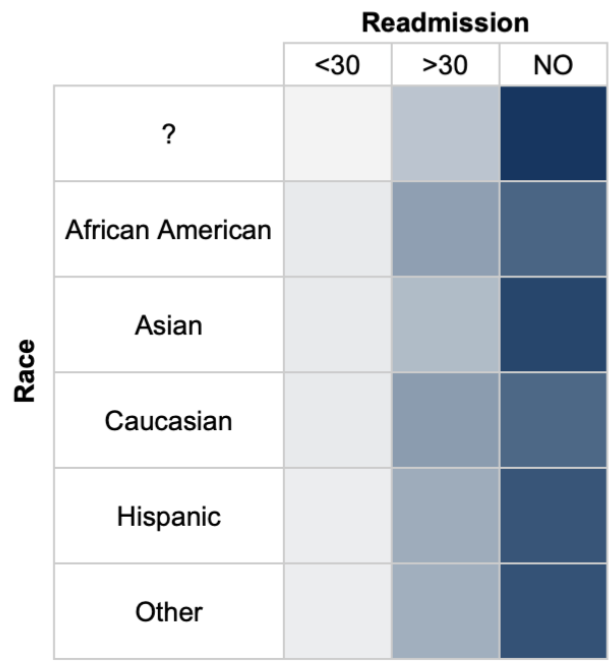
Each row is normalized to 100%, showing the percentage distribution within that row rather than across the entire dataset.
In the readmission analysis, each racial group shows a similar pattern. Most admissions do not involve readmission, and when readmission occurs, it is most likely after more than 30 days.
C. Patient Care History vs. Readmission Risk
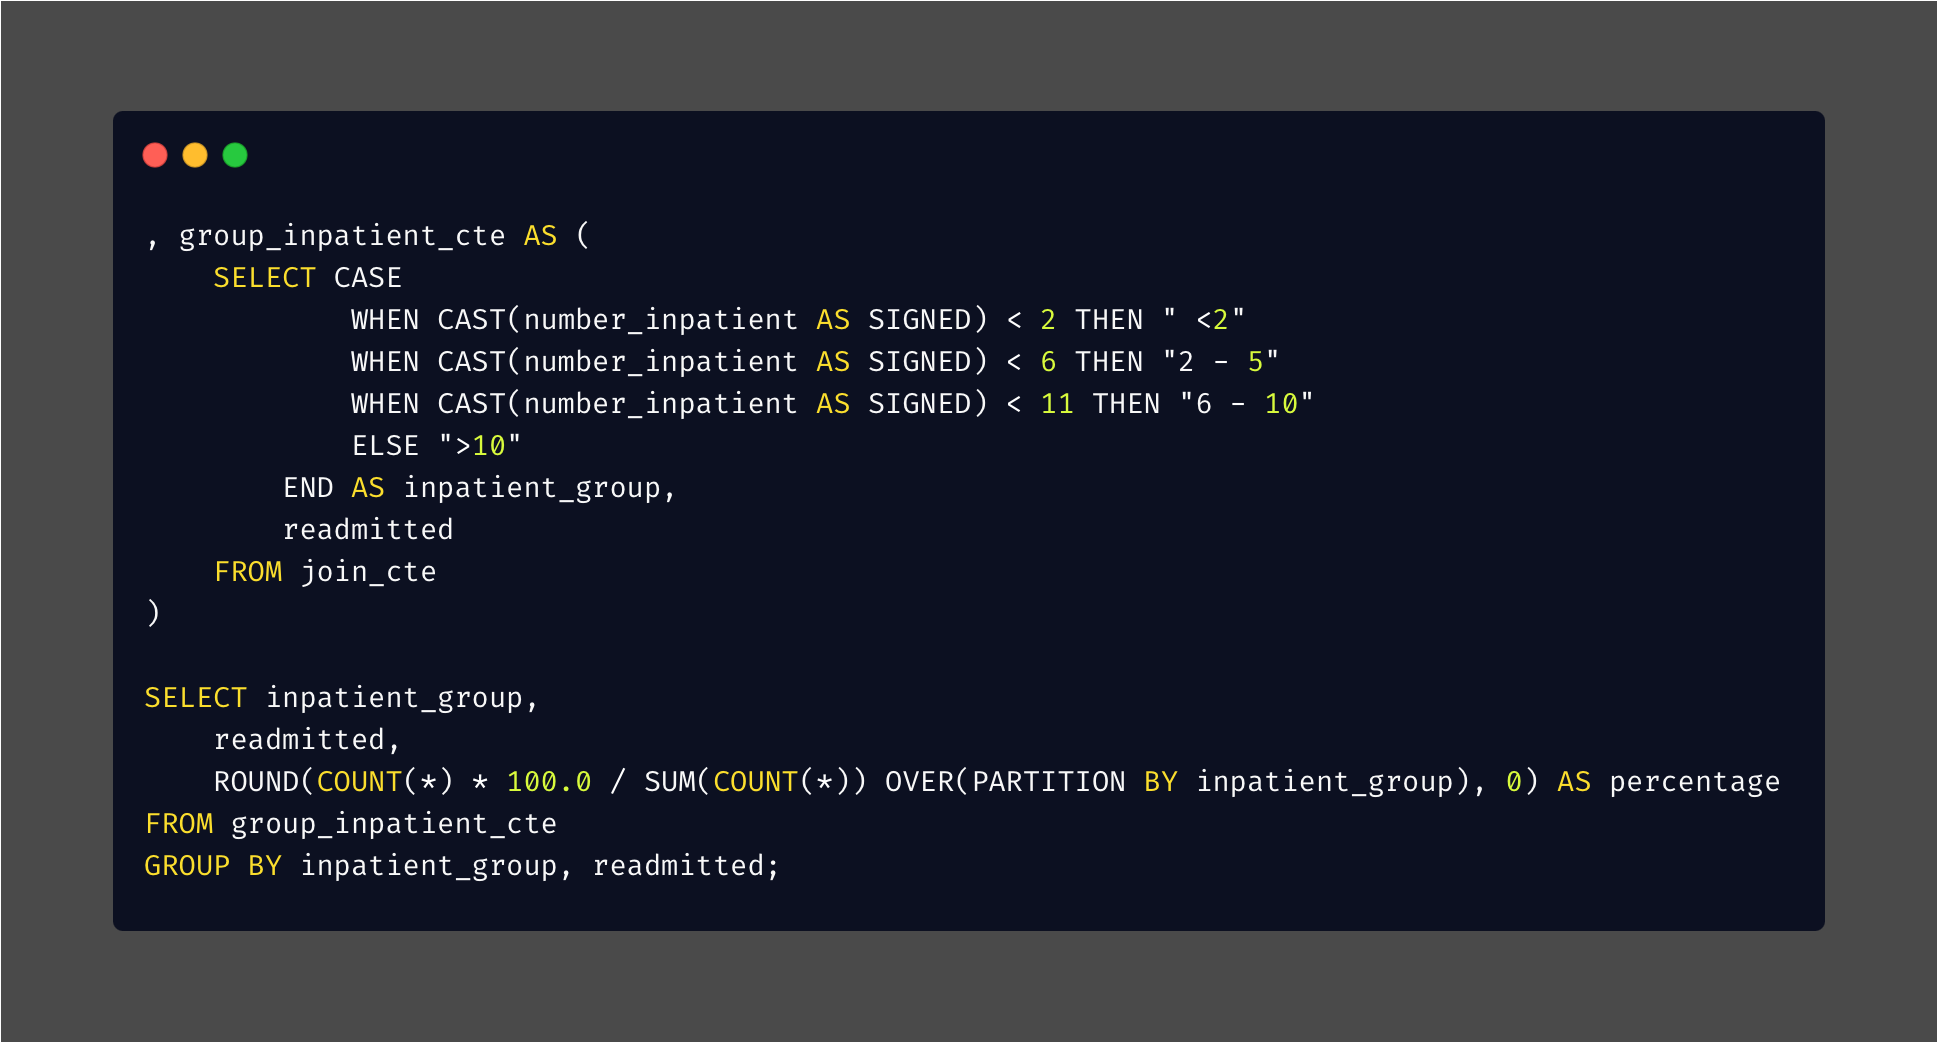
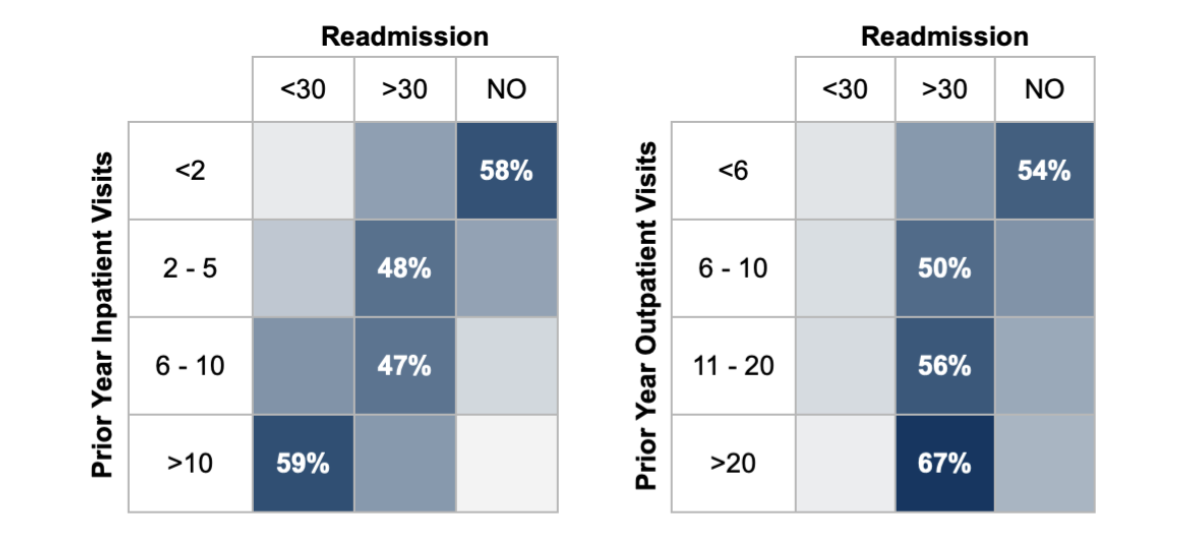
* Query for the outpatient visit similar to the inpatient visit, but changed the observed column from number_inpatient to number_outpatient and adjust the range accordingly.
** Each row is normalized to 100%, showing the percentage distribution within that row rather than across the entire dataset.
Based on data from the previous year’s inpatient visits, a higher number of inpatient visits correlates with increased readmissions within 30 days. Specifically, when there were more than 10 inpatient visits in the prior year, over 50% of patients were readmitted within 30 days. Contrarily, among patients with 1 or no prior inpatient visits, more than 50% did not experience readmission.
Analysis of prior year outpatient visits indicated that having more than 20 visits did not significantly correlate with readmission within 30 days. However, among patients with 6 or more prior outpatient visits, 50% or more were readmitted after 30 days, and the readmission rate increased with the number of previous outpatient visits.
Recommendations
- Many patients with diabetes ended up in the hospital because they came in from the emergency room during emergency situations. To help prevent these emergency visits, it’s important to make regular check-ups more accessible and provide better education and support for patients. These steps can help individuals take better care of their health and may help prevent emergencies.
- Fewer Hispanic and Asian patients with diabetes were admitted to hospitals than the overall population share in the US. Conducting more research to understand the reasons behind this disparity would be valuable, especially for health experts and policymakers.
References
- https://www.who.int/news-room/fact-sheets/detail/diabetes
- https://pmc.ncbi.nlm.nih.gov/articles/PMC10574155/
- https://diabetesatlas.org/
- https://www.worldometers.info/world-population/us-population/
- https://www.who.int/news-room/fact-sheets/detail/diabetes
- https://www.who.int/news-room/fact-sheets/detail/the-top-10-causes-of-death
- https://archive.ics.uci.edu/dataset/296/diabetes+130-us+hospitals+for+years+1999-2008
- https://usafacts.org/data/topics/people-society/population-and-demographics/our-changing-population/?endDate=2008-01-01&startDate=1999-01-01