I created this visualization to pay tribute to Agatha Christie, one of my favorite authors.
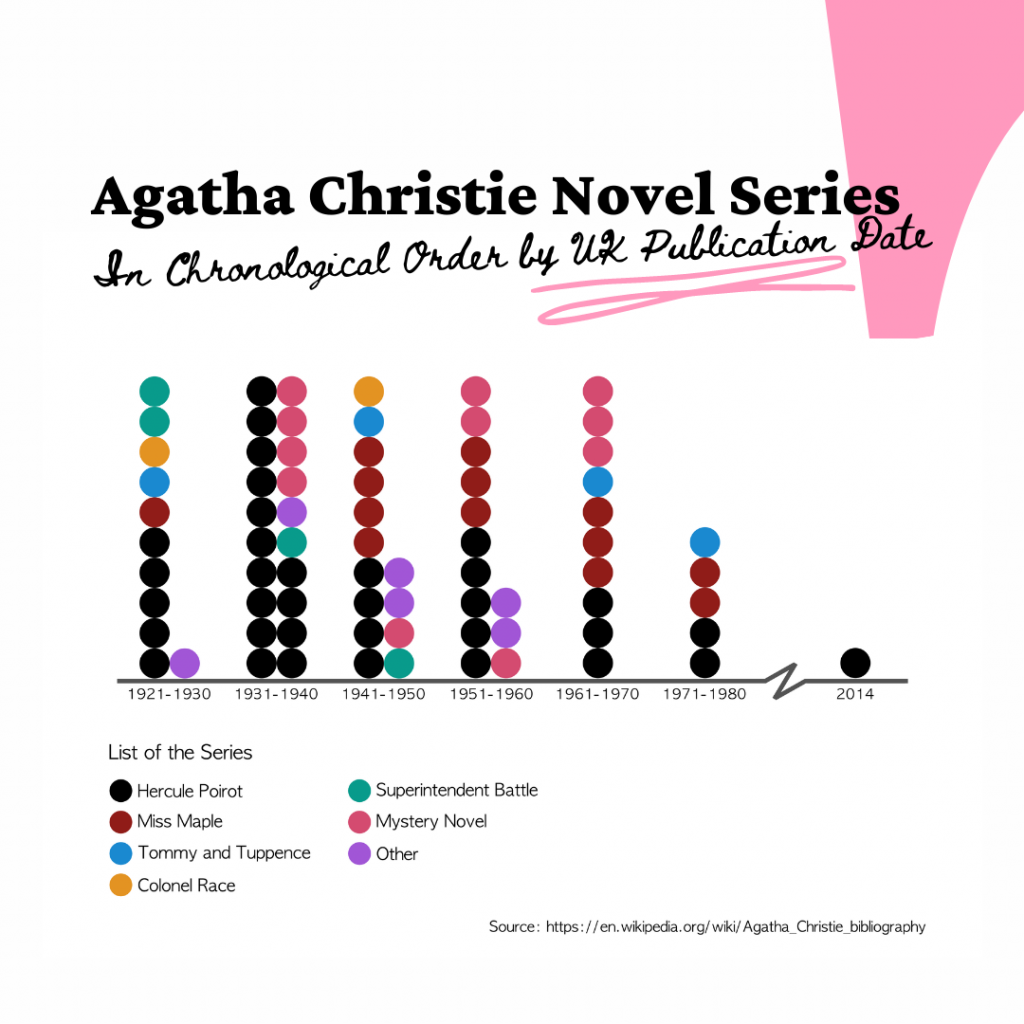
I obtained the data from Wikipedia, analyzed it using Google Sheets, designed the graph using Affinity Designer, and finalized the visualization with Canva*.
P.S. I would like to express my gratitude to Mb Gemi for inspiring me to create this project.
*When you join Canva using this link, I may get one of the premium photos, icons, or illustrations.